
The clean energy segment is getting NASDAQ: SEDG">smoked this year as solar companies are warning of the collapse in installation demand. Companies like SolarEdge Technologies Inc. (NASDAQ: SEDG) and microinverter manufacturer Enphase Energy Inc. (NASDAQ: ENPH) recently NASDAQ: ENPH">slashed guidance, resulting in an additional 30% haircuts to their already weak stock prices. SEDG is down 73% year-to-date (YTD), and ENPH is down 67% YTD. However, not all segments in the clean energy sector have been devastated. Nuclear energy is still thriving. Nuclear energy requires fuel by way of uranium. Uranium companies have been outperforming in 2023. Here are two uranium stocks to consider adding to your portfolio, even as a hedge against a falling market.
Cameco Co. (NASDAQ: CCJ)
The topic of uranium and potential yields upon completing construction upon passing through regulatory approvals is a long, arduous and speculative process. There are so many so-called uranium "plays" concerning junior exploration companies that have yet to be produced. Rather than indulge in long-term speculation, wasting time and effort hoping, why not cut to the chase with the world's largest actual uranium producer, which is a publicly traded company? That means taking a look at Cameco Corp.
The king of the Mounties
Cameo is a Canadian uranium mining and processing company accounting for nearly 20% of the world's uranium production. The company has been transitioning to its Tier 1 run rate, which is 25 million pounds of uranium. If the company were to take advantage of all Tier 1 expansion opportunities, then its annual share of tier-one uranium supply could be around 32 million pounds.
Momentum has been building for over 18 months, and gross profit is improving with the transition to Tier 1. The uptick in new investor interest (which includes resource, energy, clean energy and infrastructure investors) surpasses anything the company has seen in 16 years. The company has 118 million pounds of long-term contracting in 2023 as the uranium market moves to replacement rate contracting. There are an estimated 57 new nuclear reactors under construction worldwide, with 21 in China followed by nine in Africa and the Middle East, eight in India, and seven in Asia.
Wars keep uranium prices elevated
Geopolitical instability tends to drive up not only oil prices but also uranium prices. The threat of nuclear war is a key driver as it can disrupt the supply of uranium. The Ukrainian War caused uranium prices to rise 40%. The Israeli War is keeping prices elevated at 10-year highs.
Cameco CEO Tom Gitzel states, "And we have the type of experience that gets us invited into the room when important policy decisions are being made about how best to support the nuclear fuel cycle. And, of course, it's an appreciation of the compelling opportunity to invest in the growing demand for nuclear power and a clean and secure energy future. That growing demand has placed the security of nuclear fuel supplies at the top of our customers lists." The global landscape is becoming more accommodating to clean, zero-emission electricity, including nuclear.
Demand outpacing supply
On August 2, 2023, Cameco reported its Q2 2023 earnings of a loss of one cent per share, beating analyst estimates by five cents. Revenues fell 13.6% to $482 million, still crushing analyst estimates for $352.87 million.
Average realized prices were 11% higher than the year-ago period. The company has delivered 15.2 million pounds in the first six months of 2023. As of June 30, 2023, Cameco had long-term contracting commitments requiring annual delivery of 28 million pounds over the next five years versus 26 million at the end of March 2023. The company closed the quarter with $2.5 billion in cash and cash equivalents and $1 billion in total debt.
Raised full-year 2023 revenue outlook
The company increased its consolidated full-year 2023 revenue outlook from $2.4 billion to $2.5 billion, from previous estimates of $2.2 billion to $2.4 billion. This is driven by rising uranium prices and increased deliveries in its uranium segment. Cantor Fitzgerald upgraded shares of CCJ to a Buy from Hold on October 25, 2023.
Cameco analyst ratings and price targets are at MarketBeat. Cameco peers and competitor stocks can be found with the MarketBeat stock screener.
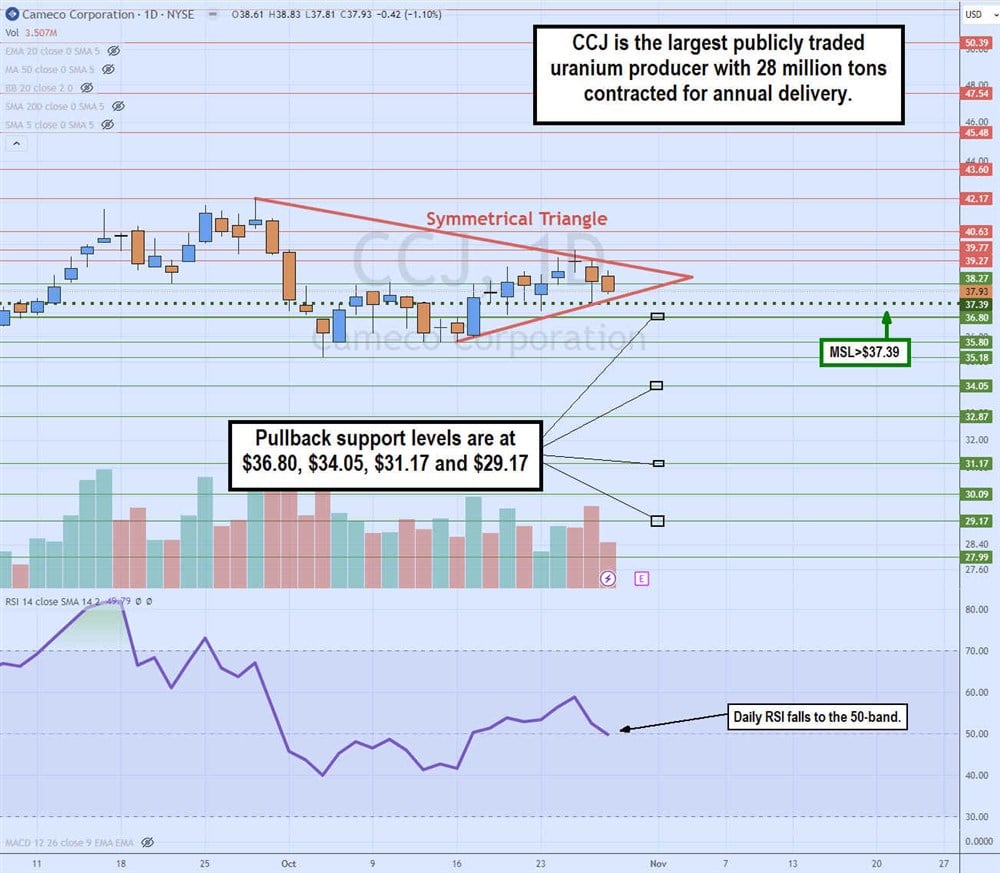
Daily symmetrical triangle pattern
The daily chart on CCJ illustrates a symmetrical triangle pattern. The descending upper trendline resistance has fallen since its $42.17 peak on September 28, 2023. The ascending trendline support has been rising since October 16, 2023. The daily relative strength index (RSI) has slipped to the 50-band. The $36.80 is a gap-fill price level going back to May 2014, acting as a support level. Pullback supports are at $36.80, $34.05, $31.17 and $29.17.
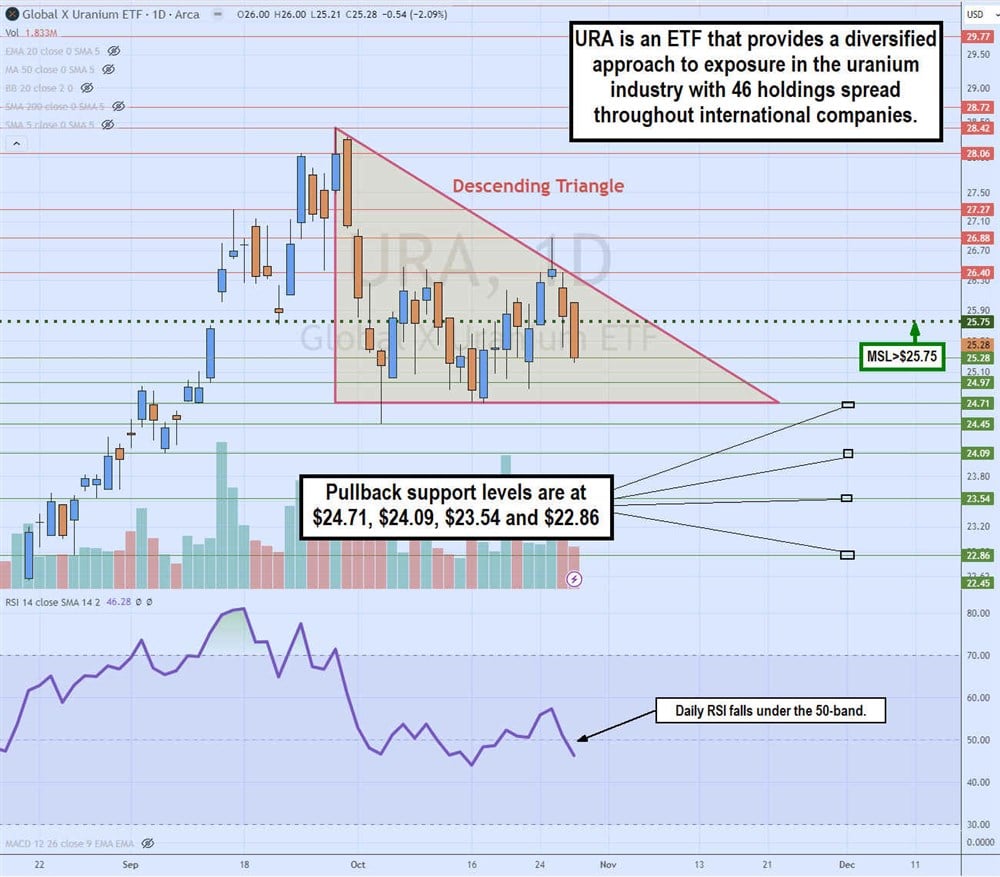
Global X Uranium ETF (NYSEARCA: URA)
If you want to be more diversified in the uranium segment, consider a liquid exchange-traded fund (ETF) like the Global X Uranium ETF. The ETF has $2.09 billion in net assets comprised of 46 holdings and 82.1 million shares outstanding. Global X gives you diversification by owning uranium companies on different worldwide stock exchanges.
Top Five Holdings
The top holding is the largest publicly traded uranium producer, Cameco Co., with a 23.2% weighting or 12.8 million shares. The second largest holding is Sprott Physical Uranium Trust Fund (OTCMKTS: SRUUF), with an 11.52% weight or 13.76 million shares. The third largest holding is JSC National Atomic Co. Kazatomprom (OTCMKTS: NATKY), with a 6.55% weighting or 3.59 million shares. The fourth largest weighting is NextGen Energy Ltd. at 6.46% or 23.4 million shares. The fifth-largest weight is Uranium Energy Co. (NYSEAMERICAN: UEC) at 5.4% or 20.5 million shares.
Global X Uranium ETF institutional ownership data can be found on MarketBeat.
Weekly Symmetrical Triangle
The weekly candlestick charts show a symmetrical triangle pattern forming since the pandemic low of $52.66 in March 2020. COLM spiked to a high of $111.19 in April 2021 and has since proceeded to make lower highs and higher lows. The lower highs create the descending trendline, while the higher lows form the ascending trendline. The weekly MSL trigger is at $68.08. The weekly RSI is attempting to bounce towards the 50-band. Pullback supports are at $69.82, $64.05, $61.80 and $59.11.


