Global container shipping and logistics company ZIM Integrated Shipping Services Ltd. (NYSE: ZIM) stock has rebounded. Its 49% dividend is a real standout. It makes one wonder why ZIM isn't a no-brainer buy for income investors. The problem is the underlying volatility of the stock and the shipping container industry and the fallacy of dividends.
There needs to be a better understanding of the mechanics of how dividends work concerning the pricing of the underlying stock. It's the "other" problem with ZIM as a pure dividend play.
The Misunderstanding of Dividends
The other fundamental problem to understand regarding dividend stocks is that the dividend is not "free." Often, stocks drop in price by at least equivalent to the dividend price. This makes sense since the dividend represents the cash per share dispersed from a company's balance sheet.
If a company issues a $2 cash dividend, the stock is intrinsically worth $2 less, based on the cash drop. Shareholders also have to claim the dividend payout as income.
The Dividend is Real, But…
ZIM declared a $2.95 per share dividend on its Q3 2022 earnings report. The payable date was Dec. 7, 2022, for shareholders of record on Nov. 29, 2022. The ex-dividend date was Nov. 28, 2022. The ex-dividend date represents the date when the dividend is no longer payable. So what happened on the ex-dividend date?
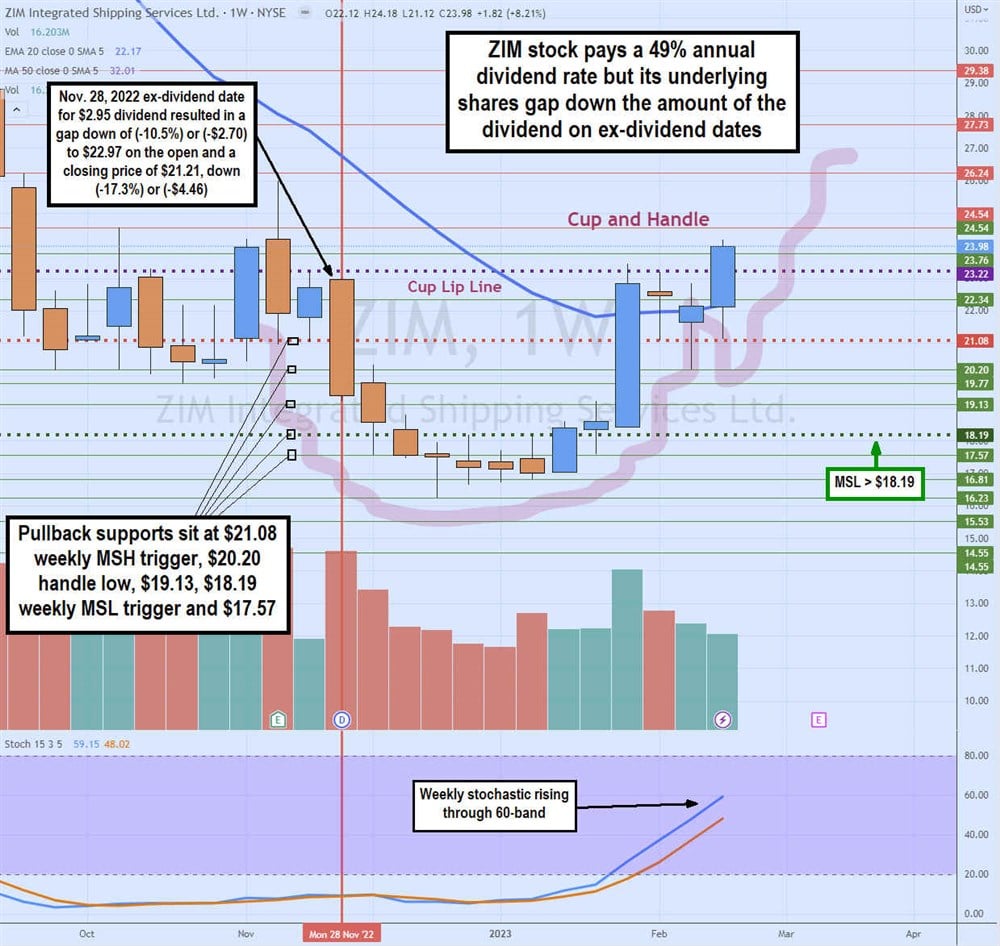
On Nov. 27, 2022, ZIM stock closed at $25.67. On the ex-dividend date, Nov. 28, 2022, ZIM opened at $22.97, down ($2.70) or (10.5%). Shares only hit a high of $23.00 and closed at $21.21, down (17.3%). This translates into receiving an 11.5% dividend, but the underlying stock fell (-10.5%) on the open and ended the day losing ($4.46) or (17.3%). Granted, the S&P 500 index fell (1.6%) that day.
The bottom line was that shareholders lost more value in the underlying stock than they gained from the dividend on the ex-dividend date. On top of that, they have an income tax bill since dividends are usually taxed as income unless it's a qualified dividend which is taxed at long-term capital gains.
A Look Under the Hood
On Nov. 16, 2022, ZIM released its third-quarter 2022 results for the quarter ending in September 2022. The company reported an earnings-per-share (EPS) profit of $9.66, excluding non-recurring items, beating consensus analyst estimates by $0.19. Revenues grew 2..92% year-over-year (YoY) to $3.23 billion, beating consensus analyst estimates by $21.86 million. The company revised full-year 2022 guidance for adjusted EBITDA of $7.4 billion to $7.7 billion and adjusted EBIT of $6 billion to $6.3 billion. The company declared a dividend of $2.95 or $354 million.
ZIM CEO Eli Glickman commented, "The proactive steps we have taken over the past two years, combined with our balance sheet strength, have transformed ZIM and significantly enhanced our resilience both commercially and operationally, to best position our Company for the 'new normal.”
ZIM competes with other shippers like Diana Shipping Inc. (NYSE: DSX) and Genco Shipping & Trading Ltd. (NYSE: GNK).
Analyst Reactions
On Feb. 13, 2023, Barclays downgraded ZIM shares to Underweight with a $15 price target, down from Equal Weight and $26.50 price target. Analyst Alexia Dogani believes the industry will be oversupplied from 2023 through 2024.
Capacity is expected to grow 10% annually, but demand is tracking down (3%) compared to 2019. Freight rates are expected to fall under pre-pandemic levels, which poses a big problem as costs are still 45% to 70% above pre-pandemic levels.
On Feb. 16, 2023, JPMorgan upgraded ZIM shares to Overweight with a $30.40 price target, up from Neutral. Analyst Samuel Bland said he's expecting negative cash flow from 2023 to 2025 but believes ZIM will still have $2.3 billion in net cash at the trough. This presents value for investors. He commented, "We are increasingly confident that the 46 newbuild charters may be quite competitively priced.”
Weekly Cup and Handle
The weekly candlestick chart on ZIM illustrates a cup and handle breakout. The cup lip line formed in November 2022, peaking at $23.22 as it sold off to a low of $16.23 by December 2022. Shares staged a rally on the weekly market structure low (MSL) breakout through $18.19.
The weekly stochastic mini pup helped ZIM retest the cup lip line by the end of January 2023, as it peaked at $23.45 and reversed back down to $20.20. The bounce from there forms the handle as shares rally again to the cup lip line on a breakout attempting to hold above there. Pullback support levels are $21.08 weekly MSH trigger, $20.20 handle low, $19.13, $18.19 weekly MSL trigger, and $17.57.


