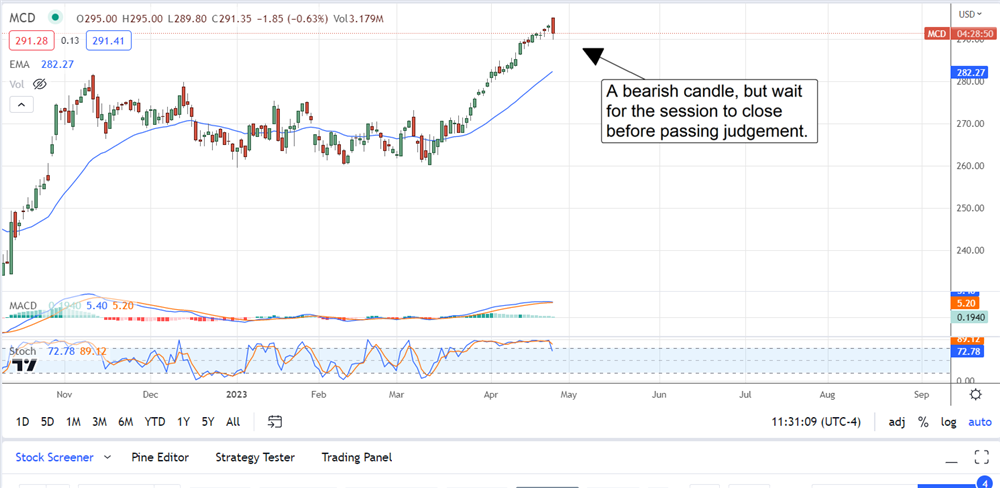
McDonald’s (NYSE: MCD) Q1 results are respectable and drove the stock to a new all-time high, but this is a top for it and perhaps the fast-food industry that could impact pricing action the rest of the year. The stock hit a new all-time high, but profit takers and speculators took the move as a cue for selling. The price is down more than 0.5%, forming a potentially bearish candle that will lead to more selling pressure. It’s affecting stocks across the industry, including Wendy’s (NYSE: WEN), Restaurant Brands International (NYSE: QSR) and Jack in the Box (NASDAQ: JACK), and that candle is a Bearish Engulfing Pattern.
A Bearish Engulfing Pattern forms when a market hits a new high and sells below the prior candle’s opening. In this case, the sell-off engulfs the prior 5 days of trading and is a potent signal. The caveat is that the trading session isn’t closed yet; the market could rebound, but it tells us higher prices will be hard to come by.
McDonald’s Q1 Report Sizzles, But Analysts Aren’t Excited
McDonald’s Q1 report is sizzling and led to optimism for the year, but there are no new price targets or rating changes that Marketbeat.com has picked up on. The revenue of $5.9 billion is up 4.1% and beat the consensus estimate expecting a decline. The gains were driven by traffic and pricing actions, leading to a near 13% comp in the US and International markets. Systemwide sales are up 9%, driven by strength in digital channels and core markets. The company says digital sales in its top 6 markets accounted for 40% of all sales.
"Our strong first quarter results demonstrate that our Accelerating the Arches strategy is working, as comparable sales grew 12.6% through a healthy balance of strategic menu price increases and positive traffic growth," said Chris Kempczinski, McDonald's President and Chief Executive Officer
The company also widened the margin and drove mouth-watering results on the bottom line. The operating income is up 10%, the net income 63% and the GAAP earnings 66%, but the news isn’t quite so robust on an adjusted basis. The adjusted $2.63 is up 15% compared to last year and beat the consensus by $0.29, which is great but the analysts question if the growth is sustainable. McDonald’s plans to open another 1,500 stores in 2023, so growth is on the table.
The question is if comp growth will continue at a double-digit pace or if pricing increases will have a detrimental impact over the long term. The company only reaffirmed its FY guidance which assumes some of this year’s strength was front-ended in the Q1 report, and the rest of the year may not be as good.
The sell-side activity is favorable to higher prices. The analysts view the stock as a Moderate Buy, and the price target, which assumes fair value at current levels, is trending higher. The stock has received numerous commentaries, upgrades and price target increases since the 1st of the year, and many of the targets are above the consensus and into the $300 range.
Assuming no change to that scenario, this stock should recover its footing and consolidate at the current level, and the institutions are also buying. The institutions own about 67% of the stock and have been buying on balance for 3 consecutive quarters and the last 12-month period.
The Technical Outlook: A Storm For MCD Investors
McDonald’s stock is in a near-term and long-term uptrend that may not be over, but it has reached a point of pause. The candle formation may not lead to a deeper price pullback, but it should be expected to move sideways in consolidation at best. If the stock can not hold the current levels, it could fall back to the short-term EMA near $282, a longer-term 150-day EMA near $270 or even deeper levels.