
Standex International Corporation (NYSE: SXI) is up over 4% in the last week. This is a continuation of a rally that started in the industrial machinery stock in September 2022. The stock is showing bullish technical buying signals. And it may also be getting a catalyst from some short covering.
If you’re a trader looking for a momentum stock, Standex looks like an ideal candidate. In the last two weeks, the stock has hit some bullish technical indicators. Specifically, the stock is now above both its 20- and 50-day simple moving average; it’s up about 4% in the last 30 days and continues to make new highs, and the relative strength index is around 60%.
Fundamentally, there are some things to like, but the stock is looking properly valued, and it may be better to wait for a pullback before taking a position.
In the Right Places at the Right Time
Standex Industrial is a conglomerate that is involved with many of the sectors that will drive the economy in the next decade. Specifically, the company is seeing its sales increase in fast-growing markets such as renewable energy, electric vehicles, soft trim automotive OEM market, the commercialization of space, and the defense sector.
These five sectors contributed $60 million in revenue in 2022, up 35% from the $40 million from these sectors in 2021. This year, the company expects a 40% gain to $80 million, and by the end of 2028, the company expects these sectors to generate $200 million in 2028. That assumes a compound annual growth rate (CAGR) of 20% between 2023 and 2028.
Analysts are projecting an average earnings gain of approximately 15% in the next five years with low single-digit revenue growth. That suggests that they may not be as bullish as the company. Still, the company does appear to be involved in the sectors where investment capital is likely to flock.
Some Short Covering May be at Work
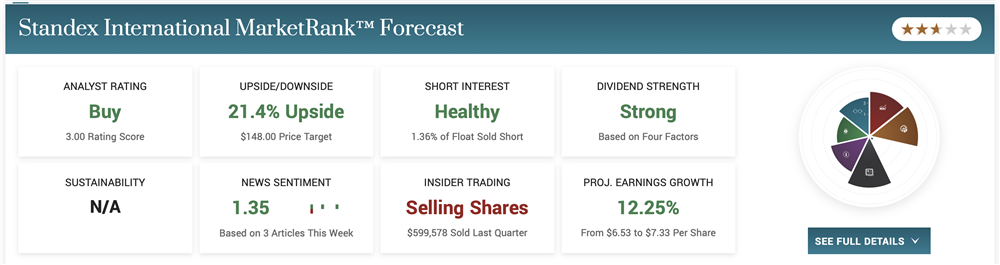
At just 1.36%, short interest in SXI stock is not that high on a percentage basis. In the last month, however, short interest has jumped over 31%. That was understandable. The stock was trading at a 52-week high while investors were weighing uncertainty about the global economy in general and the banking sector in particular.
And in fairness, as recently as March 15, it looked like that was a good trade. The stock would fall below its 50-day simple moving average, which is almost always a bearish signal. But it appears that as investors have begun to put the banking crisis in their rearview mirror, they’re getting more comfortable putting their money where the growth will come from.
That activity has pushed the stock up nearly 10%. And analysts tracked by MarketBeat give SXI stock a consensus price target of $148, which would be about a 20% gain from the current price.
An Interesting Trade
Standex Industrial is clearly a momentum trade at this point. And it may have some room to go even higher in the short term. As a long-term investment, the outlook is a bit more cautious.
SXI stock deserves a spot on your watchlist, but it’s looking a little overvalued at this point. The P/E ratio is around 21x earnings which is in line with the average of the S&P 500 Index, which is around 22x. And while the stock has a 12-year streak of increasing its dividend, and the dividend looks sustainable, the yield is still at only 0.91%. Therefore, you should wait for an opportunistic pullback in price to maximize the opportunity in their position.


