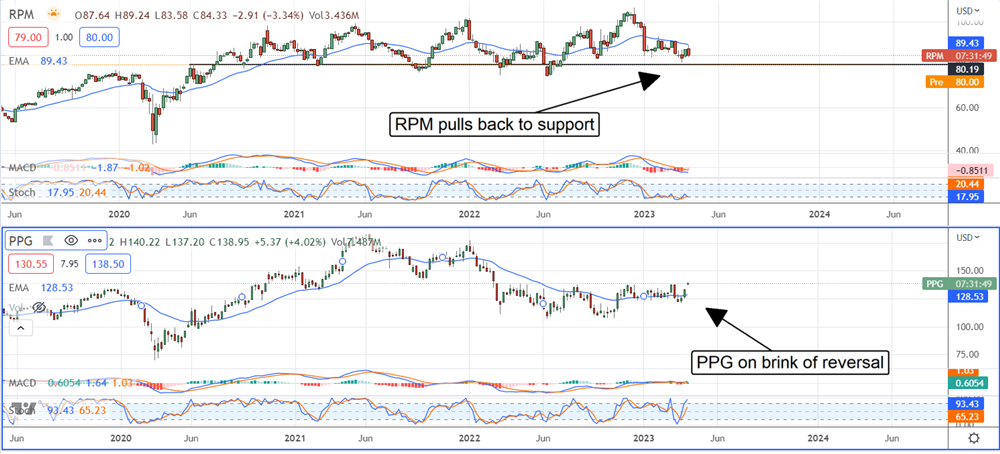
Shares of RPM International (NYSE: RPM) are pulling back to critical levels following the Q3 report and guidance, but it might be the time to buy. The report was strong and guidance positive if tepid and with an air of caution. The takeaway for investors is that competitor PPG Industries (NYSE: PPG), which reports later this month, raised its guidance recently and garnered a round of price-target upgrades with that stock in reversal.
While RPM International is facing headwinds, its diversified model is sustaining healthy cash flows that, in turn, support a healthy dividend. Trading at nearly 20X earnings, the stock isn’t exactly a value, but neither is PPG, and both are solid blue-chip dividend-paying stocks with a long history of dividend increases.
“Given the increasingly cautious economic outlook, we are focused on executing initiatives within our control. These include MAP 2025 initiatives, where we continue to make structural improvements to our costs and working capital to drive margins and cash flow. We remain on track to exceed our year-one MAP 2025 EBIT target of $120 million.
Additionally, we are aligning resources with demand levels, launching new products over the next several quarters, and leveraging our strong positions in expanding end markets that serve infrastructure and reshoring projects,” said CEO Frank C. Sullivan.
RPM International Falls On Record Results
RPM International reported a solid quarter supported by higher pricing and internal efforts to position for the times. The $1.52 billion in revenue is up 6.3% compared to last year outpacing PPG’s expected growth by more than 600 basis points. The strength was driven by gains in all operating segments, although there were regional strengths and weaknesses.
On a segment basis, Construction products grew by 3.1% to trail the group. Performance Coatings led with a gain of 10.6%, followed by a 9% increase in Sepcialty and a 7.5% increase in Consumer Products. Regionally, North America and Latin America were strongest, up 8.% and 7.3%, while EU sales fell due to FX headwinds. FX shaved 2.3% off of the top line.
Margin news is good, too, although mixed. The company’s EBIT grew by 4.2% to reach a record despite continued margin pressure. Cash flow increased roughly 66%, but the GAAP and adjusted earnings are down. This is due primarily to increases in working capital and inventory intended to alleviate supply chain issues.
Both working capital and inventory are expected to normalize over the coming quarters and be a tailwind to earnings. The adjusted $0.37 EPS is down a penny compared to last year but beat the Marketbeat.com consensus by $0.06.
The news weighing on the market is the guidance. The company’s revenue guidance aligns with the consensus, but the EPS is expected to decline as much as -9% at the low end of the range. That puts full-year EPS a nickel below the consensus figure, but guidance is cautious, and the high end of the range has EPS flat compared to last year and above the consensus.
The Analysts And Institutions Support RPM International
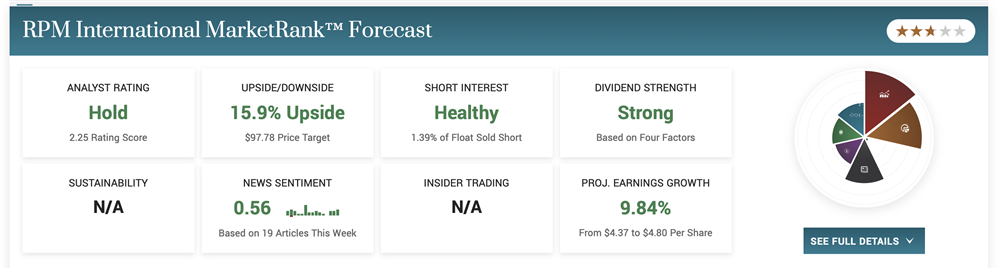
The analysts have yet to comment on RPM’s results and guidance, but they are rating it a Firm Hold with a price target 15% above the pre-release action. The most recent changes were in January and were price target reductions but to levels above the consensus price. The institutions are more bullish on the stock, having purchased shares in the ratio of 2:1 over the last 12 months compared to selling. They own about 81% of the stock and have a bottom in the price near the $80 mark.
Post-release action has the market down more than 5% but still above key support. Assuming the $80 level produces a bounce as it has in the past, this stock will remain range bound in the $80 to $100 range. If not, it could fall below $80 and move to the $70 range or lower, presenting a better value and yield.