
monday.com Ltd. (NASDAQ: MNDY) provides workflow collaboration and customer relationship management (CRM) software applications used by over 180,000 companies. monday.com is used by 59% of the Fortune 500 companies through 200 countries in more than 14 languages and services more than 200 industries with work teams ranging from two to more than 7,000 workers. The NYSE: CRM">software is so well received and elastic that it continues robust growth despite more challenging macroeconomic conditions as companies implement more significant cost-cutting measures.
Large Enterprise Customers
Despite a weakening IT spending environment, monday.com defies gravity as its Work OS platform continues to see elastic demand driving revenues and free cash flow to a new quarterly record. The platform centralizes workflows, projects and communication integrated with numerous applications in one shared workspace to save time and bolster efficiency and output. Some of its well-known customers include popular brands like The Coca-Cola Company (NYSE: KO), Glossier., Universal Music Group, Hulu and LIONSGATE.
Automation and Integration
Apps like Zoom Video Communications Inc. (NYSE: ZM) can be used to have video meetings. It integrates automation capabilities to collaborate across teams from anywhere seamlessly. Its mobile app can access everything and get updates on the go. monday.com announced it plans to incorporate Monday artificial intelligence (AI) into the platform. The company competes with workflow collaboration providers like Dropbox Inc. (NYSE: DBX), Salesforce (NYSE: CRM), Smartsheet Inc. (NASDAQ: SMAR) and Asana (NYSE: ASAN).
Blowout Quarter
On May 14, 2023, Monday.com released its first-quarter 2023 results for the quarter ended March 2023. The company reported earnings-per-share (EPS) profits of $0.14 versus a loss of ($0.29) consensus analyst estimates, a $0.43 beat. Revenues grew 50% year-over-year (YoY) to $162.3 million, beating analyst estimates of $155.29 million.
Customers with annual run rates (ARR) over $50K rose 75% YoY to 1,683. The company achieved record quarterly revenue and cash flow. The company announced it would be incorporating AI into the platform. The net dollar retention rate was more than 115%, indicating that existing customers are escalating their spending driven by the launch of Work OS products and mondayDB.
Co-CEO Insights
monday.com co-CEO Roy Mann stated that its Monday sales CRM product is notably strong. Its intuitive and simple UI is easier to use than competitors' CRM tools. It's driving strong adoption as an add-on service to existing customers. Total CRM accounts rose to a record 5,441 customers.
Raising the Bar
Monday.com raised its fiscal Q2 2023 revenues between $168 million to $170 million versus $165.28 million consensus analyst estimates. It raised full-year 2023 revenue expectations between $702 million to $706 million versus $690.9 million consensus analyst estimates.
AI Implementation
Co-CEO Eran Zinman added that the first version of Monday AI assistant is going live in May 2023. He commented, "The key components of our AI strategy include increasing monday.com user's efficiency, increasing our own internal efficiency, and in the future, harnessing the power of our proprietary data, spanning over 200 different business verticals.”
Its features include email composition, document salaries and automated task generation. It will open its platform to third-party developers to construct AI apps on the platform starting in June 2023. The company will apply AI internally, utilizing its data to automate sales operations and integrate AI later into its BigBrain business intelligence (BI) tool.
Monday.com analyst ratings and price targets can be found on MarketBeat.
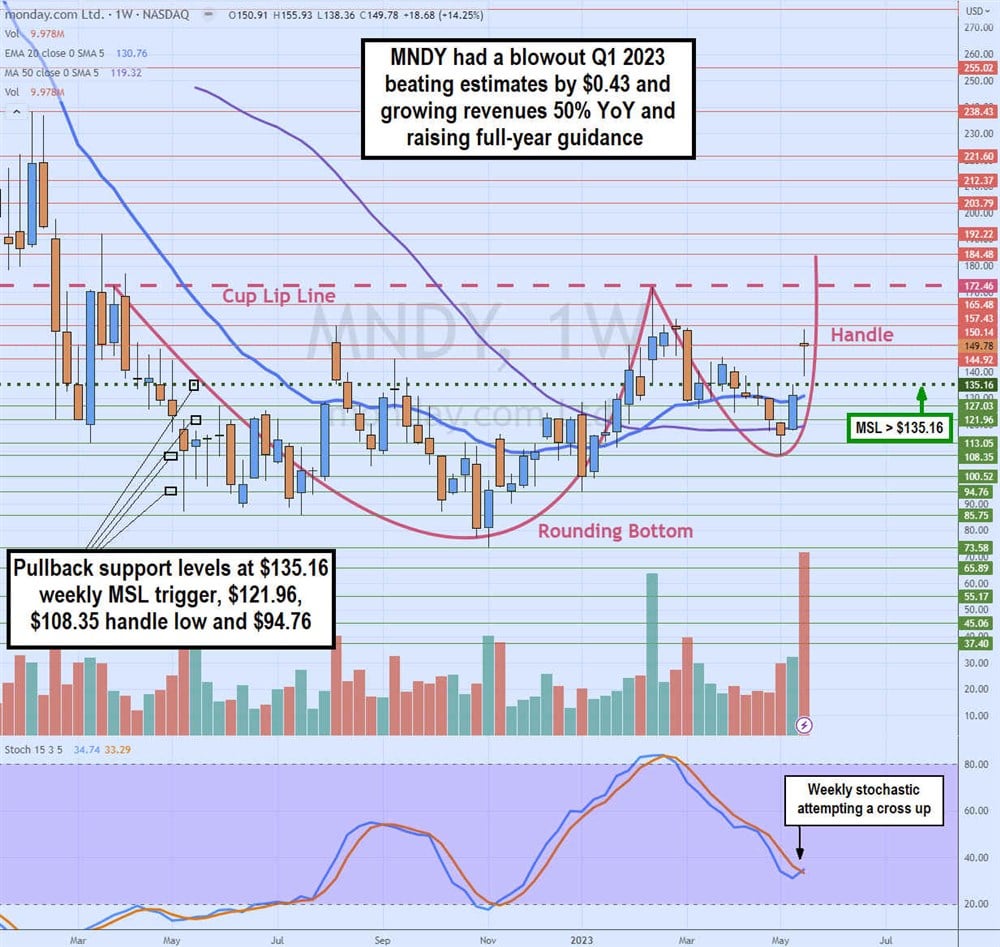
Weekly Cup and Handle
The candlestick chart on MNDY shows the cup and handle breakout attempt starting to form. The cup lip line formed after peaking at $172.46 in March 2022. Shares chopped their way down to a low of $73.58 in November 2022 before staging a rally to retest $171.89 near the cup lip line in February 2023.
Shares fell back to a handle low of $108.35 before staging a rally on the weekly market structure low (MSL) breakout through $135.16, spiking up as high as $155.93 on its blowout Q1 2023 earnings report.
The weekly stochastic downward oscillation attempts to cross back up near the 35-band. MNDY would need to break through the lip line at $172.46 to trigger the cup and handle the breakout. Pullback support levels are $135.16 weekly MSL trigger, $121.96, $108.35 handle low and $94.76.


