The manufacturing giant that is General Electric (NYSE: GE), founded in 1892, needs no introduction. However, the extent of the company's current transformation might be less known to you. GE recently announced a change in its CFO position. Additionally, GE has successfully spun off GE Healthcare (NASDAQ: GEHC) and plans to divide its aerospace and energy businesses by 2024. The company's realignment, emphasizing the aerospace and renewable energy industries, is taking shape. With a solid first quarter performance and the transformation well and truly underway, the momentum is quickly building in GE, with shares up about 58% so far in 2023.
General Electric Leadership Change
As the company progressed with its transformation, it announced that Carolina Dybeck Happe would depart from her CFO role. The individual tasked with taking over is Rahul Ghai. The move comes as GE edges closer to launching GE Vernova and GE Aerospace as separate entities, as the company CEO Larry Culp stated.
First Quarter Earnings and Projections
For the first quarter, GE reported impressive numbers. The company was able to turn around its EPS, which came in at 27c versus a loss during the same period last year. Sales increased 14% from the previous year, totaling $14.5 billion. Looking ahead, analysts are expecting an increase of 93% in earnings for the year. GE raised its full-year guidance for the year, projecting EPS between $1.70 - $2 and estimating free cash flows of $3.6 billion - $4.2 billion. Previously, GE estimated free cash flows at $3.2 billion - $3.4 billion. The company demonstrated strong growth potential, and with solid financials and improving fundamentals, I can see why optimism has been building.
General Electric's Share Price
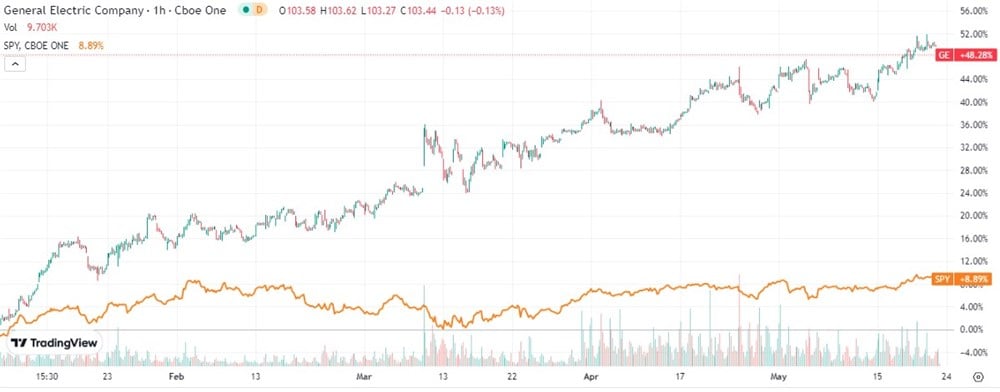
Shares of GE are up about 58% YTD, while the SPDR S&P 500 ETF (NYSE: SPY) is only up 9%. Head to MarketBeat's chart tab under any company profile to conduct similar comparisons.
While the relative strength of GE vs. the overall market is impressive, the risk of a pullback in shares of GE greatly outweighs the reward of further upside momentum at current levels.
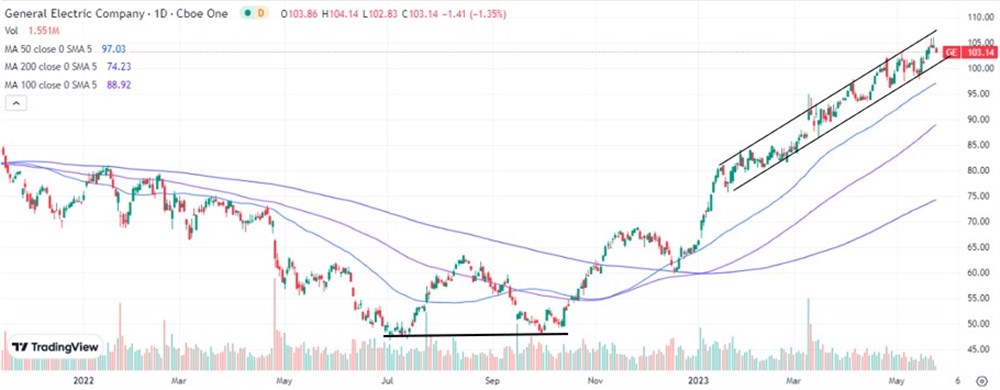 Since putting in a double bottom in late September last year, shares of GE haven't looked back. The stock has soared over 100% from the lows last year. Over a year, shares of GE are up about 75%, significantly outperforming their nearest competitors. The expansion and disconnect in share price from key moving averages, the 200d, 100d, and 50d SMA, also indicates that the stock is overbought across multiple timeframes. The stock is currently in an upward contracting channel, and a break of support in the area of $100 - $101 could result in a swift shift in momentum. That change of character should create a better opportunity to purchase shares closer to the 100d and 50d SMA.
GE is undoubtedly committed to driving value for its shareholders, and indeed over the past year, the company has successfully delivered on that promise. However, as an investor or trader, it's always important to weigh the risk vs. reward before opening a new position. In the short term, shares appear overbought and susceptible to a pullback.


