 Cleveland-Cliffs (NYSE: CLF) shares rose by as much as 4.0% during Monday's trading session, which could have been taken as an optimistic expectation of better things to come. Some improving developments were coming up in the works as the company reported its second quarter 2023 earnings results, reiterating market opinions.
Regarding the momentum that the earnings expectations created, it is a sticky one. The stock is also trading higher during the pre-market hours of Tuesday morning, advancing by nearly 1.0%. Despite the small percentage move, investors can lean on a solid technical pattern that may extend the newfound upside momentum.
Markets are turning their heads away from Cleveland-Cliffs, enacting the stereotype that stocks are in a 'popularity contest' in the short term. However, for those investors looking for the highest upside potential, despite having to sit through a longer 'value investing' time horizon, Cleveland stock can be a clear prospect for a future purchase.
Understanding the Path
Cleveland-Cliffs stock has formed a chart pattern, which, combined with other factors, lays the foundation for a more extensive bullish run. Going back to the 2020 bottom price of $2.66 per share, a strongly supported uptrend has continued up to this day, leaving the stock to bounce higher after the latest test.
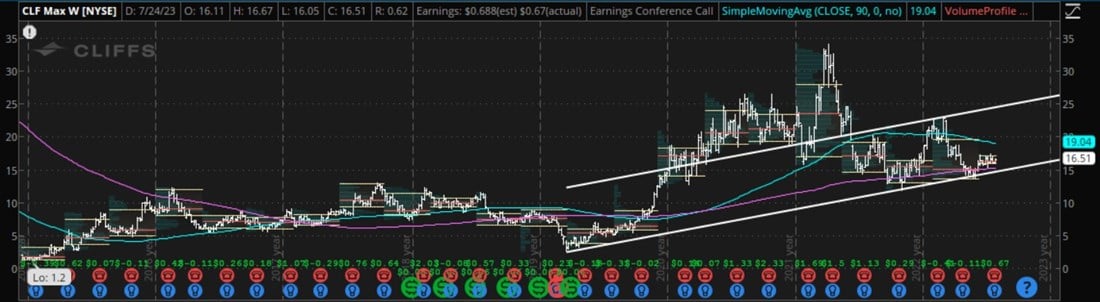
The above image will showcase a tight uptrend channel in the stock, which has recently been tested and respected. Investors considering a possible investment in this reliable steel operator can rest assured, as they can still hop in at the lower sections of the channel and ride on the newfound momentum seen in earnings.
Furthermore, the purple line across the price bars will represent the infamous 200-day moving average. This reference level typically represents a strong inversion in previous price trends; otherwise, the mark of a new bear/bull market shall stock prices cross it.
Considering that Cleveland stock briefly crossed the 200-day moving average, coupled with the test of the bottom in the uptrend channel, a new inflection point has been made. Now that the moving average has been rejected and the uptrend support is being continued, investors can lean on this behavior and count it as the birth of a new rally.
The question now becomes, how does Cleveland-Cliff compare to its respective peer group, and what happened within the latest quarterly results that could have aided in the continuation of this new pattern confirmation? Following the same 'popularity contest' logic, looking at relative price performance can be a good start.
Competitors like United States Steel (NYSE: X) and Commercial Metals (NYSE: CMC) have outperformed Cleveland-Cliffs stock by as much as 52% during the past twelve months, a sign of which names the market has deemed popular. However, popularity and favoritism are cyclical beasts, and falling behind has only made Cleveland the highest potential name.
Turning the Ship
Within the quarterly earnings report, Cleveland management pointed to some future developments which may have been the cause of the stock's advance. Expecting further cost increases and a continued tailwind from the automotive shipping segments can all aid in margin expansion.
Despite posting slowdowns in the top and bottom lines, the company still generated enough free cash flow (Cash Flow from Operations minus Capital Expenditures) to repurchase up to $100 million of stock from the open market. Being able to repurchase stock during a slowing year can be a testament to a more significant characteristic.
A well-managed business can accurately plan and expect future capital needs, enabling management to manage the business' capital more effectively. Considering that the steel industry is highly capital-intensive, this tight grip on the vital signs of the firm can be a foreshadowing of what the business can achieve moving forward.
Management also pointed out a debt repayment of $550 million during the quarter, aiding the operational flexibility for the challenging quarters to come in the industry amid an uncertain economy. Cleveland also finished the quarter with total liquidity of $3.8 billion, marking the highest level in company history, reinforcing the ability to react to pivoting market trends swiftly.
Considering that Cleveland stock carries the lowest valuation multiples in the tight peer group, investors can rest assured that while it is not the most popular stock today, fundamental drivers will take the wheel and effect a rotation that values healthy and growing cash flows over popularity.
On a forward price-to-earnings ratio basis, which values the next twelve months of earnings rather than the past, Cleveland trades at 8.4x, significantly lower than United States Steel's 12.8x and Commercial Metals' 9.0x. Cleveland-Cliffs analyst ratings agree on a 23.4% upside from today's prices, reiterating that the stock carries the highest value potential in the space.


