
Experiential entertainment is a form of entertainment that immerses you in an interactive experience. It's the opposite of passive consumption, like NYSE: AMC">watching a movie or betting on a baseball game. Experiential entertainment helps you escape the daily grind and places you in the role of a player, not a spectator, whether it be games or sports.
It takes you away, awakens the senses, and temporarily injects some fun into your life. Experiential entertainment tends to be a more economically elastic endeavor from the dopamine release that can be somewhat recession-proof. Here are two experiential companies that you can put on your watchlist.
Dave & Buster's Entertainment, Inc. (NASDAQ: PLAY)
Dave & Buster’s is an immersive experience from walking through the doors. It's a combination restaurant, sports bar, arcade, amusement park and pool hall. The blaring sounds, flashing lights, video screens, bells, and carnival-like atmosphere takes you away even back to your childhood, inspiring memories of fun times.
Some locations have theaters, virtual reality (VR) games, bowling, laser- tag, skeeball, air hockey and giant immersive co-op games.
The massive locations range from 20,000 to 40,000 square feet, the first thing that hits you when you step into one. The sheer size alone takes you away. It's what makes Dave & Buster's a one-of-a-kind establishment.
The formula has worked for over 40 years since its first location in Dallas, Texas, in 1982. The company added 56 more family-style entertainment Main Event restaurant and arcade locations to their 154 locations to become the largest player in the segment.
Rapid Recovery
The pandemic lockdowns suffocated business, but it bounced back as positive normalization driven by pent-up demand has put the company well into the black. The company saw revenues rise 32.4% year-over-year (YoY) to $597.3 million in its fiscal first quarter of 2023.
Dave & Buster's made $1.45 per share in the quarter, beating analyst estimates of $1.26 per share by 19 cents. The company also bought back 3.6 million shares for $125.5 million, reducing its outstanding shares by 12%. It ended the quarter with $581.7 million in liquidity comprised of $91.5 million cash and $490.2 million available from its $500 million credit revolver.
The company opened a new Dave & Busters location in Puerto Rico and three new Main Event locations in AR, AZ and KY. They also signed two international franchise agreements to open up to 15 locations in India and five in Australia.
Dave & Buster’s analyst ratings and stock price targets are at MarketBeat.
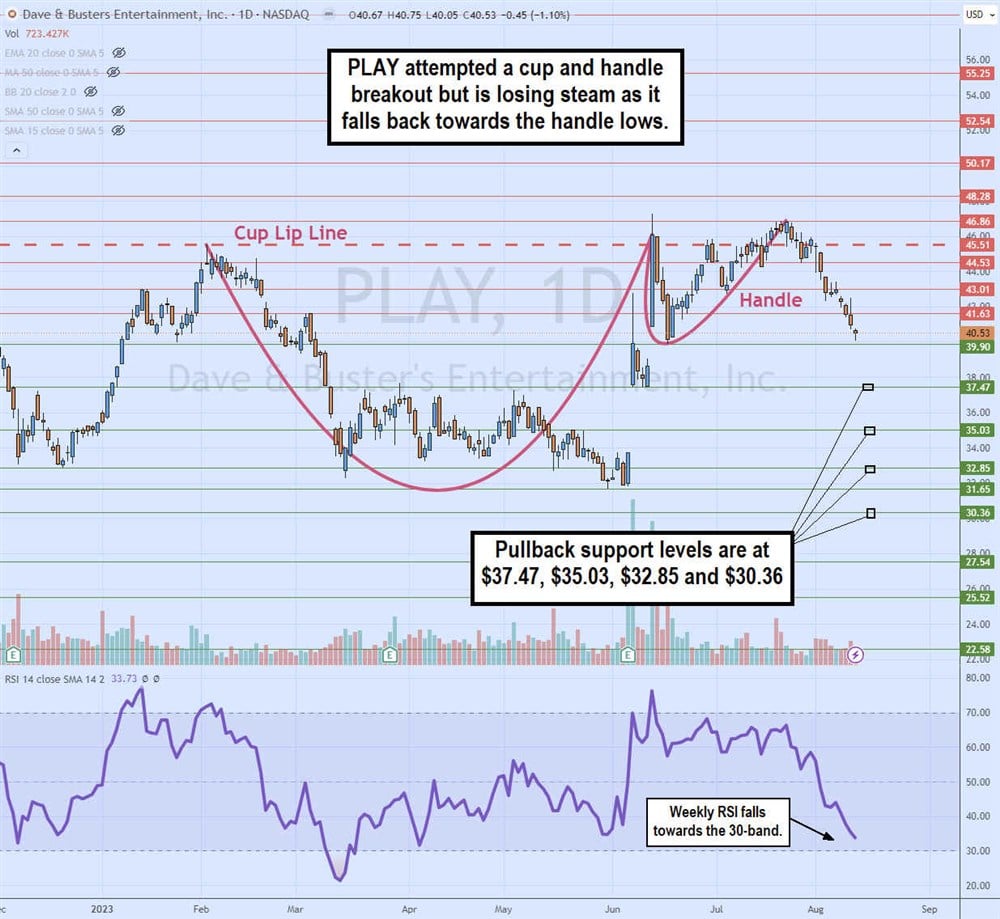
Daily Cup and Handle Pattern
The daily candlestick chart shows the cup and handles breakout attempt that broke through the lip line at $45.51 but peaked shortly after at $46.86 before cascading lower. PLAY approaches the handle low support at $39.90.
The weekly relative strength index (RSI) oscillator has steadily fallen toward the oversold 30-band level. PLAY has gaps at $39.90 and $37.47, with a final cap at $33.75. Pullback support levels are at $37.47, $35.03, $32.85 and $30.36.
Topgolf Callaway Brands Co. (NASDAQ: MODG)
Speaking of massive experiential entertainment, Topgolf venues combine restaurant and golfing ranges on 13 acres of land and 65,000 square feet of restaurant and putting space. They have poles rising 150 feet with netting to keep the golf balls from flying into the streets.
Each location is outfitted with up to 100 bays and cutting-edge tracer technology that monitors and tracks the golf balls and provides a number of different games and course simulations. Its golf bays fit up to six to eight people for golfing, gaming, food and drinks.
The company was Callaway Golf before acquiring Topgolf for $3 billion, which included 78 corporate-owned Topgolf driving ranges with climate-controlled hitting bays. It operates in three segments: Topgolf, Gold Equipment and Active Lifestyle. The acquisition of Topgolf was meant to expand its operations and introduce more consumers to the sport of golf, which it can then sell its golfing products to.
EPS Beat but Lowered Q3 2023 Guidance
Topgolf reported its second quarter 2023 earnings on Aug. 8, 2023. The company earned 59 cents per share, beating consensus analyst estimates of 34 cents by 25 cents. Net income was $117.4 million. Revenues rose 5.7% to $1.18 billion, missing the $1.19 billion analyst estimates. Topgolf opened two new venues and plans to open 11 venues in 2023. The company has $648 million in liquidity and net debt of $2.23 billion.
It lowered third-quarter 2023 revenues from $1.1050 billion to $1.1075 billion, falling short of $1.12 consensus analyst estimates. Full-year 2023 guidance was reaffirmed with earnings per share between 63 cents to 69 cents versus 65 cents analyst estimates; full-year 2023 revenues are expected between $.42 billion to $4.47 billion versus $4.45 billion estimates. It expects to be cash flow positive by the end of 2023.
Topgolf Callaway Brands analyst ratings and stock price targets are at MarketBeat.
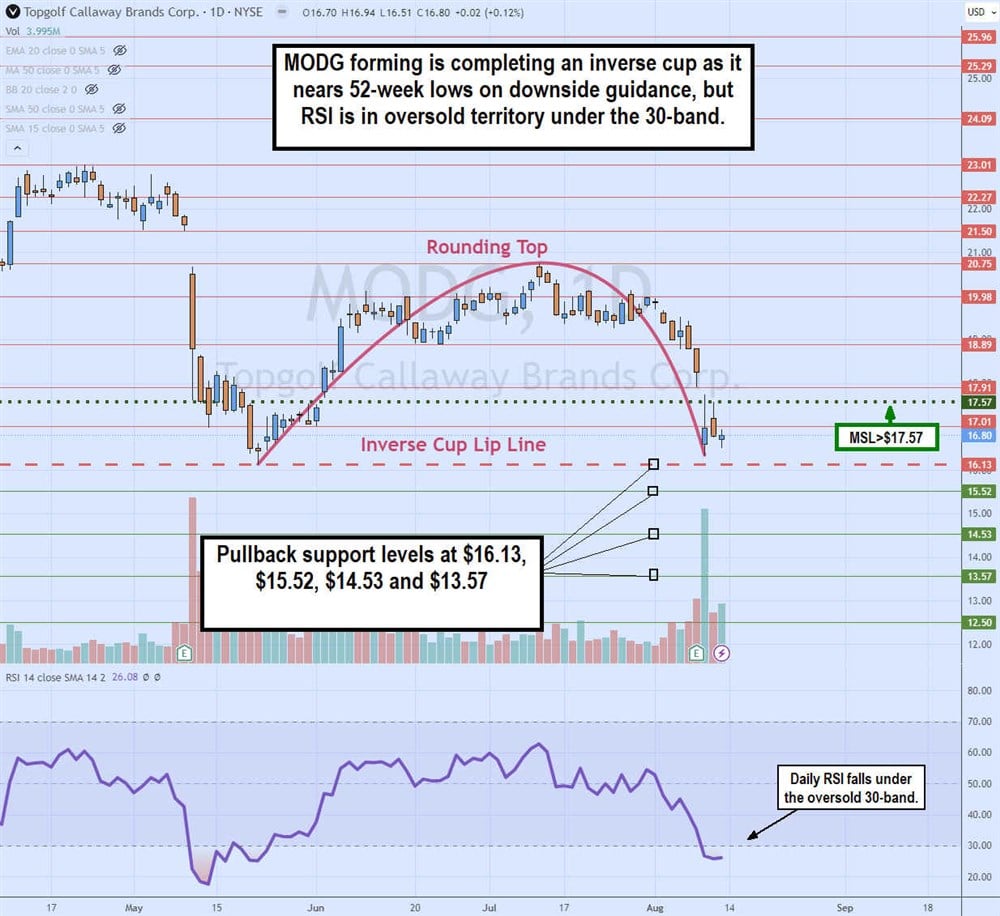
Inverse Rounding Top and Cup Pattern
The daily candlestick chart on MODG illustrates a rounding top and inverse cup and handle potential. Shares are back near their 52-week lows of $16.13, made on May 22, 2023. The weekly relative strength index (RSI) oscillator is under the oversold 30-band. The daily market structure low (MSL) triggers a breakout through $17.57.
Pullback supports are at $16.13 inverse cup line and 52-week low, $15.52, $14.53 and $13.57.


