Kellogg Company's (NYSE: K) price action is mixed following the Q2 report, but details within the release suggest the company is a Buy going into its planned separation. The separation is slated to be completed in Q4 this year and will result in 2 publicly traded companies.
The 1st will be WK Kellogg Company, a North American cereal-focused business; the 2nd is Kellanova, a global breakfast and snacking business. The opportunity for investors is multi-faceted as the split will result in 2 dividend-paying businesses and a potential multiple expansion for each.
Shares of Kellogg Company trade close to 16X earnings, a value for a consumer staple and a deep value for the 2 post-split businesses. The North American cereal company could see its valuation improve to 20X to trade in alignment with Post Holdings (NYSE: POST), while Kellanova could see a more substantial expansion.
Kellanova will resemble giant Pepsico’s (NASDAQ: PEP) snacking business, which trades at a higher 26X valuation. Regardless, the company’s growth trajectory and dividend outlook set it up for a share price advance. The stock pays more than 3.5% and is a growing distribution.
Kellogg Company Has Mixed Quarter: Raises Guidance
Kellogg Company had a mixed quarter but outperformed where it counts. The company’s $4.04 billion in net revenue missed the Marketbeat.com consensus by a slim margin but is up 4.7% YOY, 7.1% organic, and compounded by wider margins.
The company organically experienced solid growth in all regions, but significant FX headwinds in the AMEA region led to a YOY decline for that segment. The best news is that efforts to control costs, improve efficiency, and price pass-throughs led to an early margin recovery.
The company reported double-digit increases in GAAP and adjusted operating profits. The GAAP profits grew by 22.7%, adjusted by 13.9%, to deliver a solid beat on the bottom line. The adjusted $1.24% in EPS is up 5.1% compared to the 4.7% top-line growth, and it beat by $0.13.
The Q2 strength led to an increase in guidance for the year, and the guidance may be cautious. The company upped its target for revenue by 100 basis points at the low end of the range, with operating profits expected to outpace the top-line growth by 200 to 300 bps.
Both targets have the consensus figure below the mid-point with a chance business momentum will carry through into the 2nd half of the year.
Analysts Outlook Mixed: Bottom For Sentiment Is In
The analyst outlook for Kellogg Company is mixed, but the bottom is in for the market. The 9 analysts with current ratings have the stock pegged at Hold with a price target about 7% above the current action. The most recent activity includes several upgrades and raised price targets that put the stock trading at or above critical resistance.
Critical resistance is near the $75 level and the top of a recent trading range. That bottom is echoed by the institutional activity, which has been robust. The institutions have been buying on balance for 3 consecutive quarters in 2023 and have total ownership up to 83%.
The only negative in the sell-side action is that insiders, specifically the WK Kellogg Foundation, have been selling. WK Kellogg Foundation is the 7th largest charitable foundation and the #1 shareholder at nearly 16%.
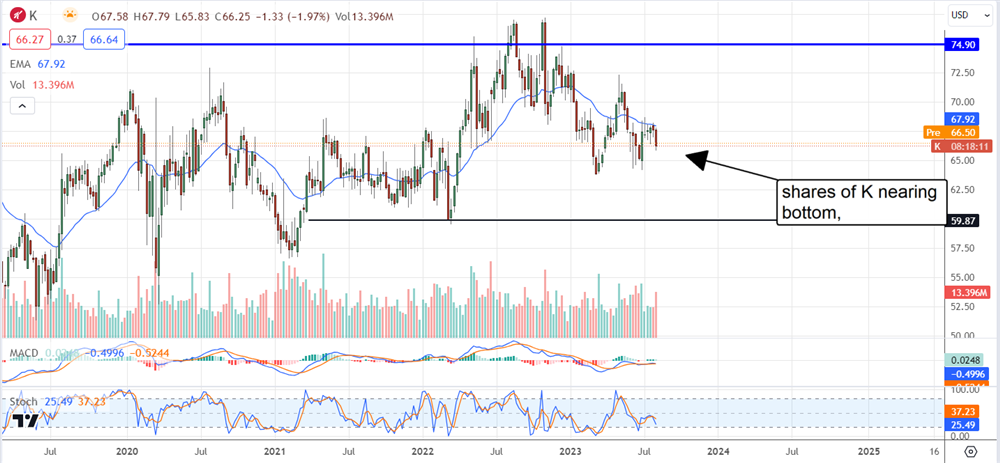
The charts are mixed. The weekly chart shows an asset trading near the middle of a trading range with a downward bias; the daily charts are similarly positioned. The next moves will be telling. If the market can not find solid support soon, a move down to the $65 or $60 level could be brewing.
The stock would present an even deeper value and higher yield in that scenario. As it is, Kellogg stock is paying about 3.6% in yield, and it comes with a healthy outlook for sustained annual distribution increases.