Intuitive Surgical (NASDAQ: ISRG) share prices surged following the Q4 release but failed to hold the gain, creating an ugly candle capping a strong rally. The market may move lower from here, but if so, it will present an even better entry point into this medtech pioneer than is already apparent. The sell-off is alarming; investors never really want to see a move such as this, but it is a healthy correction within an otherwise strong and stable uptrend that will likely result in higher share prices this year.
The takeaway from the Q4 release is twofold. On the one hand, the company is accelerating the delivery and installation of new da Vinci systems, while on the other, procedure volume is growing, providing leverage for the bottom line. The result is an outlook for sustained double-digit growth driven by the upcoming launch of da Vinci 5. Intuitive Surgical has applied for FDA approval and is in the process of answering questions. The new system has multiple advantages over the old, including increased processing power and AI capability.
Intuitive Surgical has a solid quarter; market yawns
Intuitive Surgical had a solid quarter, although results from Johnson & Johnson (NYSE: JNJ) earlier this week suggested as much. Its MedTech unit led the business with double-digit top-line growth on strength in wound closure devices. Intuitive Surgical reported $1.93 billion in revenue for a gain of 16.3% compared to last year, better than the analyst consensus forecast but by a slim margin.
Topline strength was driven by a 14% increase in YOY device installations, compounded by an increase in procedure volume. Procedure volume improved by 21% as penetration of services and growth in the end-market continues to support the entire medtech industry. Instruments and Accessories, the recurring portion of the business and the largest segment, grew by 22%.
The margin was an area of strength. The company widened its margin on improved revenue leverage and cost control to outpace the top-line performance and Marketbeat.com consensus estimate. The GAAP earnings nearly doubled, and the adjusted grew by 30% to provide ample cash flow. The company doesn’t pay dividends or repurchase shares regularly, choosing to invest in technology and business development, but that isn't bad. That strategy pays off by improving assets and shareholder equity; equity is up 20% YOY, and the company has zero debt.
Analysts are leading the ISRG market; will it follow?
Analysts' sentiment has supported Intuitive Surgical’s stock price for the last year, and the upward trend continues. Marketbeat’s analyst tracking tools picked up a handful of fresh revisions within the first day of the Q4 report, and they are all bullish. All include a price target increase, with the consensus figure up 30% compared to last year, although still aligned with the recent price action. The critical detail is that the new targets are all well above the consensus, the lowest about 15% higher and include a new high target.
The outlook for the next 18 months is robust and may sustain the uptrend in analysts' sentiment. The consensus forecasts a slight slowdown in top-line growth to 15% but for the margin to continue widening. Because the company continues to gain approval for new procedures, has a deepening penetration of existing markets, and has a growing demand in the end market, it will likely exceed its current estimates.
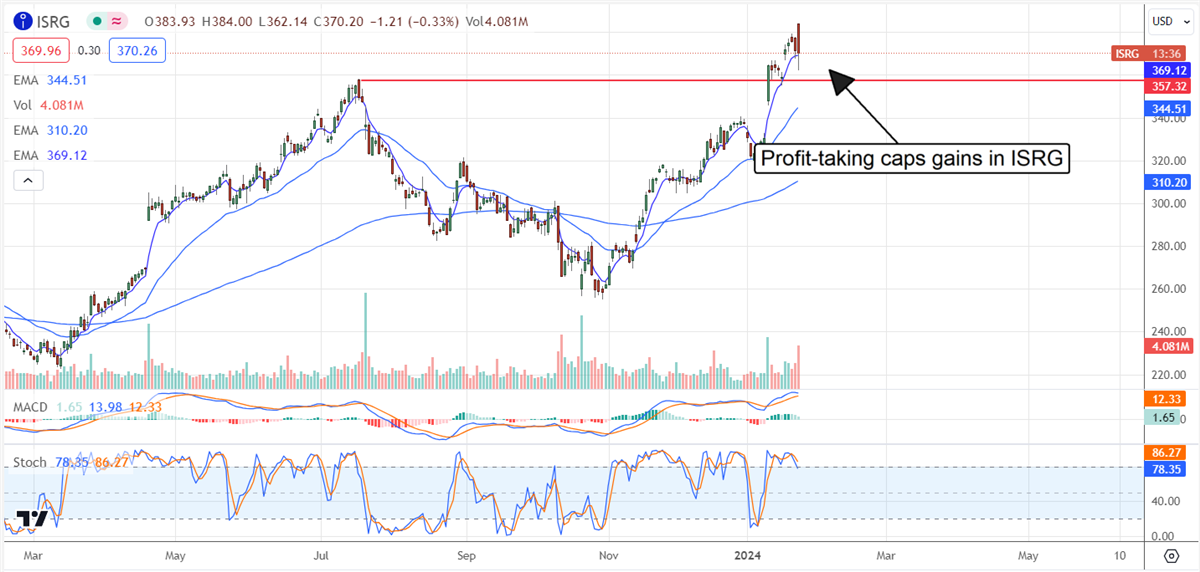
The technical outlook: Intuitive Surgical enters consolidation
The price action in ISRG surged on the earnings news and outlook, but profit-taking quickly capped the gains, resulting in a sharp selloff after the opening. However, the market found support at the 30-day EMA, suggesting a consolidation and not a correction is underway. In this scenario, the market may continue to move sideways at the current levels for the foreseeable future, but higher share prices are expected over the long term. Critical support is near $360; a move below that could result in a deeper correction, but it is not likely now.