Walgreens Boots Alliance Inc. (NASDAQ: WBA) is a leading global retail pharmacy and healthcare company. The stock is trading down 60% from its 52-week high and with a stock performance down 58.5% year-to-date (YTD). The market has punished this stock and its (remaining) top competitor, CVS Health Co. (NYSE: CVS), in the retail/wholesale sector. Competition from all fronts, including online pharmacies like Amazon.com Inc. (NASDAQ: AMZN) to department stores with pharmacies and household products like Walmart Inc. (NYSE: WMT) and Target Co. (NYSE: TGT), have eroded Walgreens's market share. Yet, its third quarter of 2024 earnings release is fueling positive sentiment in the stock as the company tries to climb its way back. Here are four reasons to consider buying the stock now.
1) The Turnaround Is Taking Shape as Growth Metrics Improve
Unlike CVS Health, which had a 9% year-over-year (YoY) revenue decline in its recent quarter, Walgreens saw its revenue grow 6% YoY to $37.5 billion, beating consensus estimates by $200 million in its fiscal fourth quarter of 2024. The company earned 39 cents per share, beating consensus estimates by 3 cents. Also, unlike CVS Health, which is also a payor through its Aetna health insurance subsidiary, Walgreens's healthcare segment operates as providers. This has shielded them from the growing medical benefits ratio (MBR) that insurers are seeing cutting into their margins, notably with their Medicare Advantage members.
Walgreens Pharmacy sales rose 9.6% YoY, with strong comparable (comp) pharmacy sales up 11% YoY. However, Retail sales dropped 3.5% YoY as comps fell 1.7% YoY. Its VillageMD revenues rose 7.2% YoY as fee-for-service revenues rose. Its Shields revenue rose 27.8% YoY, driven by growth within existing partnerships. Walgreens exceeded its target of $1 billion in cost savings in fiscal 2024.
Walgreens is also planning to trim costs by shuddering 1,200 underperforming stores over the next three years, starting with 500 in fiscal 2025. This is expected to boost free cash flow and adjusted EPS immediately.
2) Its Assets Are Worth More Than Its Market Capitalization
Walgreens's 10-K lists its current assets at $18.34 billion, which is twice its current market capitalization (cap) of $9.33 billion. Its property, plant, and equipment, valued at $9.8 billion, exceeds its current market cap. Of course, they still have total short-term and long-term debt combined, totaling $32.67 billion, which is significant. However, the interest rate cut cycle should improve its financing costs.
Approximately 78% of the U.S. population live within five miles of a Walgreens or Duane Reade, which provides convenient proximity for its healthcare services. Walgreens Find Care is a telehealth platform that connects patients and customers with healthcare options from the mobile app. The company operates over 13,000 stores worldwide, including 3,688 retail Boots stores and optician locations in the United Kingdom. Walgreens is still a major shareholder of drug and healthcare products distributor Cencora Inc. (NYSE: COR), formerly AmerisourceBergen, which it still owns 10% of, valued at around $4 billion.
3) Its Valuation Is Historically Cheap, With Prices Not Seen Since 1997
WBA stock is trading at historically cheap levels at just 3.79x forward earnings (forward P/E). Its Price-to-book (P/B) ratio is 0.33. Its price-to-cash flow is 1.37. Its price-to-sales (P/S) is 0.06. Even at $10.79 per share, it's trading at levels not seen since 1998.
WBA is the highest-paying dividend stock in the S&P 500, with a 9.25% annual dividend yield. It's also a potential reality of WBA being removed from the S&P 500 index after being replaced by Amazon in the Dow Jones Industrial Average (DJIA) on Feb. 26, 2024.
While the stock is up 15.4% year-to-date (YTD), it may get a Santa Clause rally and a January Effect rally from end-of-year tax loss selling from long-term shareholders portfolio balancing or just throwing in the towel.
4) WBA Stock Is Forming a Cup and Handle Pattern
A cup pattern is completed when the stock falls from a swing-high cup lip line to a low one, forms a rounding bottom and rallies back to retest the cup lip line. The handle forms when the stock pulls back from the cup lip line, surges back up, and remains above the cup lip line, which becomes a price support level.
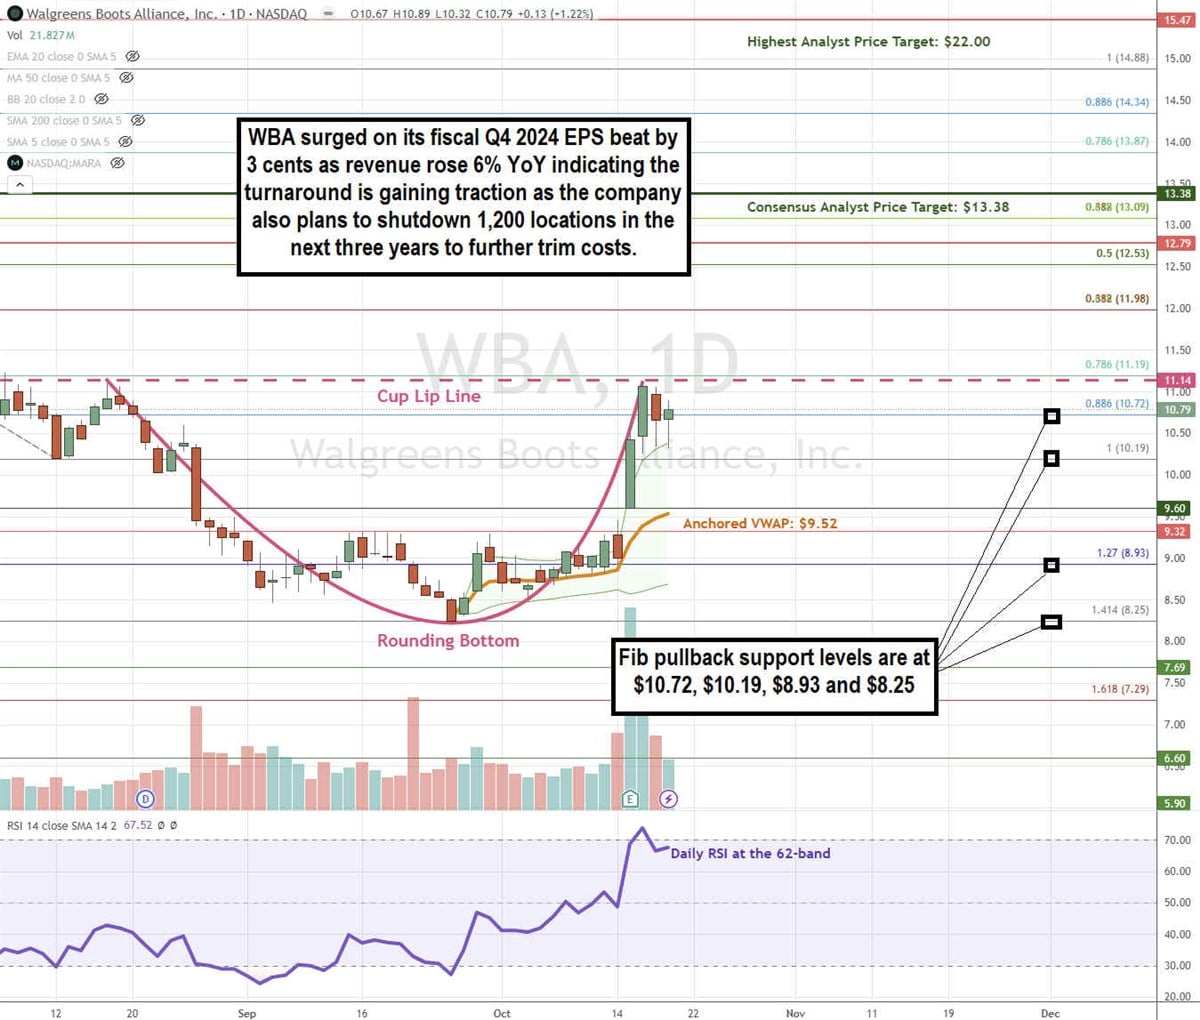
WBA formed the cup lip line at $11.14 as shares fell to a low of $8.25, forming a rounding bottom that staged a rally back to the $11.14 lip line test. WBA shares are in a pullback, which can form the handle when it reverses and trigger the cup and handle breakout if it can surge through and remain above the $11.14 lip line. The daily anchored VWAP support is rising at $9.52. The daily RSI rose to the 62-band. Fibonacci (Fib) pullback support levels are at $10.72, $10.19, $8.93, and $8.25.
Walgreens Boots Alliance’s average consensus price target is $13.38, and its highest analyst price target sits at $22.00. It has two analysts' Buy ratings, eight Hold, and four Sell ratings. The stock has a 13.3% short interest.
Actionable Options Strategies: Bullish investors can consider using cash-secured puts to buy WBA at the Fib pullback support levels for entry and write covered calls to execute a wheel strategy for income in addition to the 9.27% annual dividend yield.


