Global financial services provider American Express Inc. (NYSE: AXP) reported solid results for its third quarter of 2024 that were met with a sell-the-news reaction. While the company did beat and raise guidance, some soft spots shook investors. The bar was set high heading into earnings, with its stock trading up over 50% year-to-date (YTD) near all-time highs. Any semblance of softness was bound to trigger profit-taking. However, bullish investors may find this pullback as a buying opportunity.
The financial services sector giant was reporting after rival credit card services provider Discovery Financial Services (NYSE: DFS), which is merging with Capital One Financial Co. (NYSE: COF), reported blowout results.
A Well-Oiled Machine With a Few Kinks
American Express grew its earnings-per-share (EPS) by 6% YoY to $3.49, beating consensus estimates by 20 cents. It grew its billed business by 6% YoY to $387.3 billion, which is the total amount of transactions made in the quarter. Revenues rose 8.2% YoY to $16.64 billion, which actually fell short of the $16.68 billion that analysts were expecting. Its consolidated provisions for credit losses rose to $1.4 billion, up from $1.2 billion in the year-ago period, due to higher net write-offs as loan balances credit.
The net write-off rate was slightly higher at 1.9% versus 1.8% last year. However, it did drop sequentially from 2.1% in the prior quarter. On a positive note, the number of transactions rose 9% YoY as cardmembers are engaging more with their Amex cards. The company closed the quarter with 447.9 billion in cash and cash equivalents, which was a $1.3 billion improvement from last year.
Quality and Quantity
American Express saw card fee revenue growth was 18% YoY as card member spending grew 6%. The company attracted 3.3 million new premium card members while maintaining high retention rates and excellent credit performance. Traditionally, American Express was known for users paying off their full charge card balances monthly, but now they have flexible credit card payment plans and allow for minimum payments that accrue interest like Visa Inc. (NYSE: V) and Mastercard Inc. (NYSE: MA) credit cards.
American Express cards tend to have higher credit score requirements, especially for its premium cards, along with higher annual fees, which can range from $25 for its entry-level Green card up to $695 for its Platinum card. Its Centurion card is rumored to have a $10,000 initial fee and $5,000 annual fee with no spending limit.
Millennials and Gen-Z Are Fastest Growing Consumer Segment
American Express pointed out that the recent launch of its U.S. Consumer Gold Card with added benefits in its dining category is fueling growth with its Millennial and Gen-Z customers, helping to grow U.S. spending by 12% YoY in the quarter. This demographic represents 80% of new accounts acquired on the U.S. Consumer Gold Card. New customer retention rates are also higher than that of older generations.
The beauty of this demographic is that the company expects them to grow into higher premium cards (IE, green to fold to platinum) over time. American Express is not only an iconic affluent brand but also a functional status symbol with its iconic Gold, Platinum and Centurion (Black) American Express Cards flaunted by celebrities and social media influencers.
American Express Issues Upside Guidance
The company provided full-year 2024 upside guidance as it expected EPS between $13.75 and $14.05, which was raised from its previous guidance range of $13.30 to $13.80 versus $13.62 consensus estimates. Revenue growth is still expected at around 9%. However, this was the lower part of the 9% to 11% range it expected at the beginning of the year. This was also seen as a soft sign that spooked investors.
Softness in Travel and Entertainment and Airline Segments
American Express cardholders have shown some cautiousness in their YoY spending in the travel and entertainment segment’s airline category, which saw billed business growth of 6%, down from 13% last year. However, dining is its fastest-growing travel and entertainment category, rising 7% YoY and growing at nearly twice the overall industry rate.
AXP Stock is in an Ascending Channel
An ascending channel is comprised of parallel ascending upper trendline resistance and lower trendline supports. A breakdown occurs if the stock falls under the lower trendline.
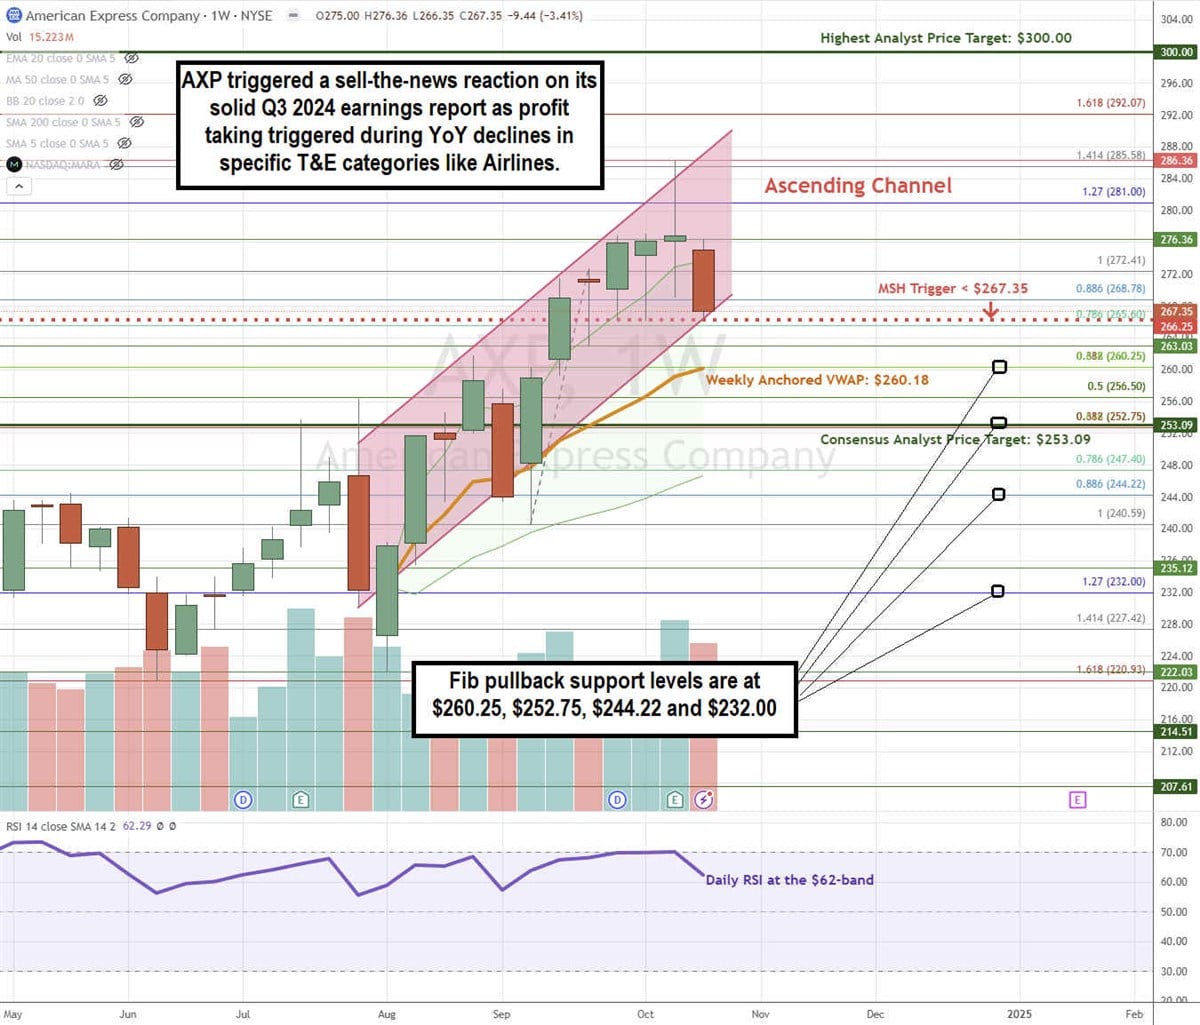
AXP has been in an ascending triangle uptrend since its $222.03 swing low. It made higher highs six days preceding earnings to set up a market structure high (MSH) sell trigger under $266.25. An MSH trigger is a three-candle formation comprised of a high, higher high and lower high candle.
The lowest point of the lower high candle market is the sell trigger, which also happens to overlap the lower trendline. The daily anchored VWAP support is at $160.18. The daily RSI is falling to the 62-band. There is more downside to watch for if the MSH triggers as the stock falls under $266.25. Fibonacci (Fib) pullback support levels are at $260.25, %252.74, $244.22 and $232.00.
American Express’s average consensus price target is $253.09 indicating a 5.3% downside, and its highest analyst price target sits at $300.00. It has 8 analysts' Buy ratings, 13 Hold ratings and 4 Sell ratings. The stock trades at 20.35X forward earnings.
Actionable Options Strategies: Bullish investors can consider using cash-secured puts at the Fib pullback support levels to buy the dip. If assigned the shares, then writing covered call at upside Fib levels executes a wheel strategy for income in addition to the 1.05% annual dividend yield.


