Quad/Graphics Inc. (NYSE: QUAD) is a global full-service marketing solutions firm for commercial clients in the retail, healthcare, NYSE: AXP">financial services, publishing and consumer packaging industries. With over 15,000 employees, the industrial products sector company offers printing services that direct mailers, catalogs and publications to data and analytics, creative and content solutions.
Some of Quad’s blue chip clients include American Express Co. (NYSE: AXP), Target Co. (NYSE: TGT), Ulta Beauty Inc. (NASDAQ: ULTA), General Mills Inc. (NYSE: GIS) and Conagra Brands Inc. (NYSE: CAG). As the advertising market rebounds, Quad should benefit from increased marketing budgets further accelerated when interest rates start to fall, ushering in economic expansion and lowering their debt servicing fees.
At the pulse of consumer behavior
Quad has to be at the pulse of consumer behavior, coining itself as a global marketing experience (MX) company. They offer in-depth research and data analytics using NASDAQ: AMZN">artificial intelligence (AI) to pinpoint consumer trends to enhance marketing campaigns and solutions for their clients. They provide end-to-end marketing solutions from printing NASDAQ: ULTA">retail inserts, in-store marketing, brochures, and publications to custom print products and promotions to "Inspire shoppers to bring your brand home." As they say, they help brands wind at-shelf with designs and unmissable media and packaging that jumps off the shelves. Quad leverages its household data to bolster its audience targeting.
Get AI-powered insights on MarketBeat.
Recovering with the economy
As the uncertain macroeconomic climate improves, companies bolster their marketing budgets, which bolsters Quad's earnings. Quad reported Q4 2023 EPS of 23 cents, beating analyst estimates by 10 cents. Revenues fell 11% YoY to $787.9 million, still beating $758.4 million estimates.
Reflecting on the full-year 2023
For the full year 2023, the company recognized net losses of $55 million, primarily attributed to restructuring costs, higher interest rates on debt and lower sales. Adjusted EBITDA was $234 million with a 7.9% margin, compared to a 7.8% margin in the year-ago period. Quad generated $148 million in net cash from operation activities and a free cash flow of $77 million in 2023. The company reduced net debt by $564 million or 55% over the past four years, achieving Net Debt Leverage of 2X at the end of 2023.
Forecasts for full-year 2024
The company sees full-year 2024 net sales of $2.69 billion to $2.81 billion or down by 5% to 9% versus $2.88 billion consensus analyst estimates. Quad expects cost savings of $60 million from plant capacity and labor reduction initiatives in response to external headwinds, which include significant postal rate increases and economic uncertainty, which negatively impacts print volumes.
Check out the sector heatmap on MarketBeat.
CEO Insights
Quad/Graphics CEO Joel Quadracci pointed out that the company had exceeded its adjusted EBITDA above its midpoint guidance in 2023. The company its adjusted EBITDA margin is consistent despite an 8% decline in annual net sales. The significant postal rate increase that was well above the rate of inflation and elevated interest rates in the financial services sector led to reduced direct mail marketing budgets. While the company expects long-term organic declines in large-scale print, they are treating all costs as variable and optimizing its print manufacturing platform by consolidating work at the plants. They are also selling off assets that are no longer required for operations.
Transitioning from direct mail to digital campaign success
Quad is aggressively pushing forward on its growth strategy as a marketing experience (MX) company. This involves delivering integrated service by solving problems and removing pain points and sources of friction during the marketing process.
They are helping customers like the branded footwear market Wolverine Worldwide Inc. (NYSE: WWW) migrate to digital campaigns from direct mail to grow and strengthen consumer connections. Quad’s testing involved multiple variables in over 1,400 different combinations to derive optimum content and design to outperform existing content. As a result, Quadracci revealed, “Wolverine achieved nearly double its response rate. Thanks to more effective digital creative and messaging, the client also doubled conversion rates, accomplishing twice the click-through rate and increasing sales, an incredible 261% per buyer.”
Quad/Graphics analyst ratings and price targets are at MarketBeat. Quad/Graphics peers and competitor stocks can be found with the MarketBeat stock screener.
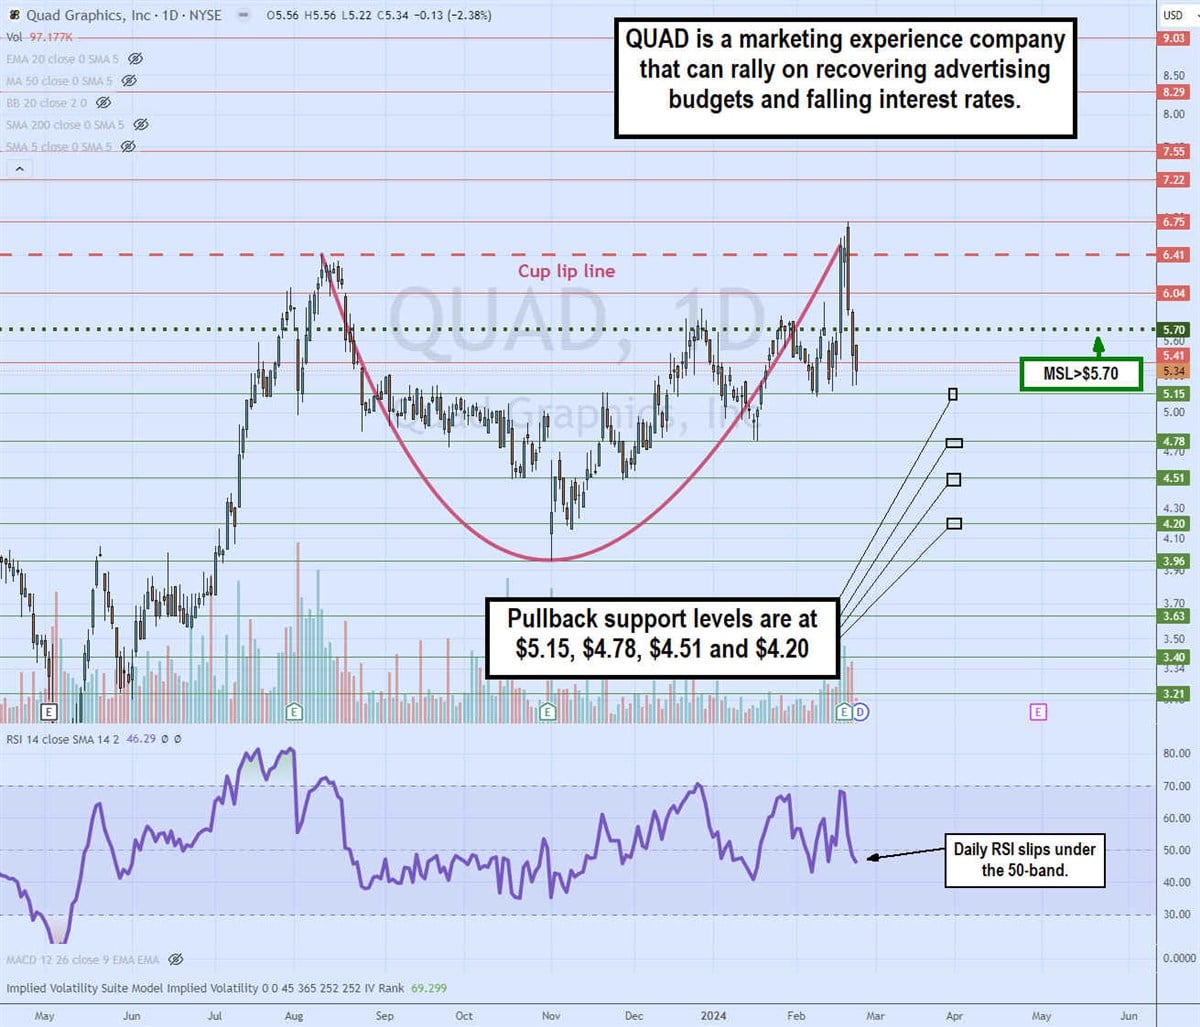
Daily cup pattern
The daily candlestick chart on QUAD illustrates a daily cup pattern. The cup lip line formed at the $6.41 swing high on Aug. 10, 2023, as it fell to the $3.96 low on Nov. 1, 2023. QUAD triggered a daily market structure low (MSL) at $5.70 on its Q4 2023 earning release to spike shares back up through the cup lip line, peaking at $6.75 on Feb. 21, 2024, before sinking back down towards the $5.15 support level.
An MSL breakout through $5.70 could commence the handle formation. The daily relative strength index (RSI) peaked at the 70-band and fell under the 50-band, awaiting a further plunge or a reversal bounce. Pullback support levels are at $5.15, $4.78, $4.51 and $4.20.


