Wireless chips maker Skyworks Solutions (NASDAQ: SWKS) met Wall Street’s revenue expectations in Q3 CY2024, but sales fell 15.9% year on year to $1.02 billion. Next quarter’s revenue guidance of $1.07 billion was less impressive, coming in 2.8% below analysts’ estimates. Its non-GAAP profit of $1.55 per share was 1.9% above analysts’ consensus estimates.
Is now the time to buy Skyworks Solutions? Find out by accessing our full research report, it’s free.
Skyworks Solutions (SWKS) Q3 CY2024 Highlights:
- Revenue: $1.02 billion vs analyst estimates of $1.02 billion (in line)
- Adjusted EPS: $1.55 vs analyst estimates of $1.52 (1.9% beat)
- Adjusted Operating Income: $273.5 million vs analyst estimates of $274.1 million (small miss)
- Revenue Guidance for Q4 CY2024 is $1.07 billion at the midpoint, below analyst estimates of $1.10 billion
- Adjusted EPS guidance for Q4 CY2024 is $1.57 at the midpoint, below analyst estimates of $1.72
- Gross Margin (GAAP): 41.9%, up from 39.2% in the same quarter last year
- Inventory Days Outstanding: 120, down from 138 in the previous quarter
- Operating Margin: 5.8%, down from 20.8% in the same quarter last year
- Free Cash Flow Margin: 38.4%, up from 24.3% in the same quarter last year
- Market Capitalization: $14.05 billion
“Skyworks’ fourth fiscal quarter revenue grew 13% sequentially, above the midpoint of our guidance,” said Liam K. Griffin, chairman, chief executive officer and president of Skyworks.
Company Overview
Result of a merger of Alpha Industries and the wireless communications division of Conexant, Skyworks Solutions (NASDAQ: SWKS) is a designer and manufacturer of chips used in smartphones, autos, and industrial applications to amplify, filter, and process wireless signals.
Analog Semiconductors
Demand for analog chips is generally linked to the overall level of economic growth, as analog chips serve as the building blocks of most electronic goods and equipment. Unlike digital chip designers, analog chip makers tend to produce the majority of their own chips, as analog chip production does not require expensive leading edge nodes. Less dependent on major secular growth drivers, analog product cycles are much longer, often 5-7 years.
Sales Growth
Examining a company’s long-term performance can provide clues about its business quality. Any business can put up a good quarter or two, but the best consistently grow over the long haul. Unfortunately, Skyworks Solutions’s 4.3% annualized revenue growth over the last five years was sluggish. This shows it couldn’t expand in any major way, a rough starting point for our analysis. Semiconductors are a cyclical industry, and long-term investors should be prepared for periods of high growth followed by periods of revenue contractions.
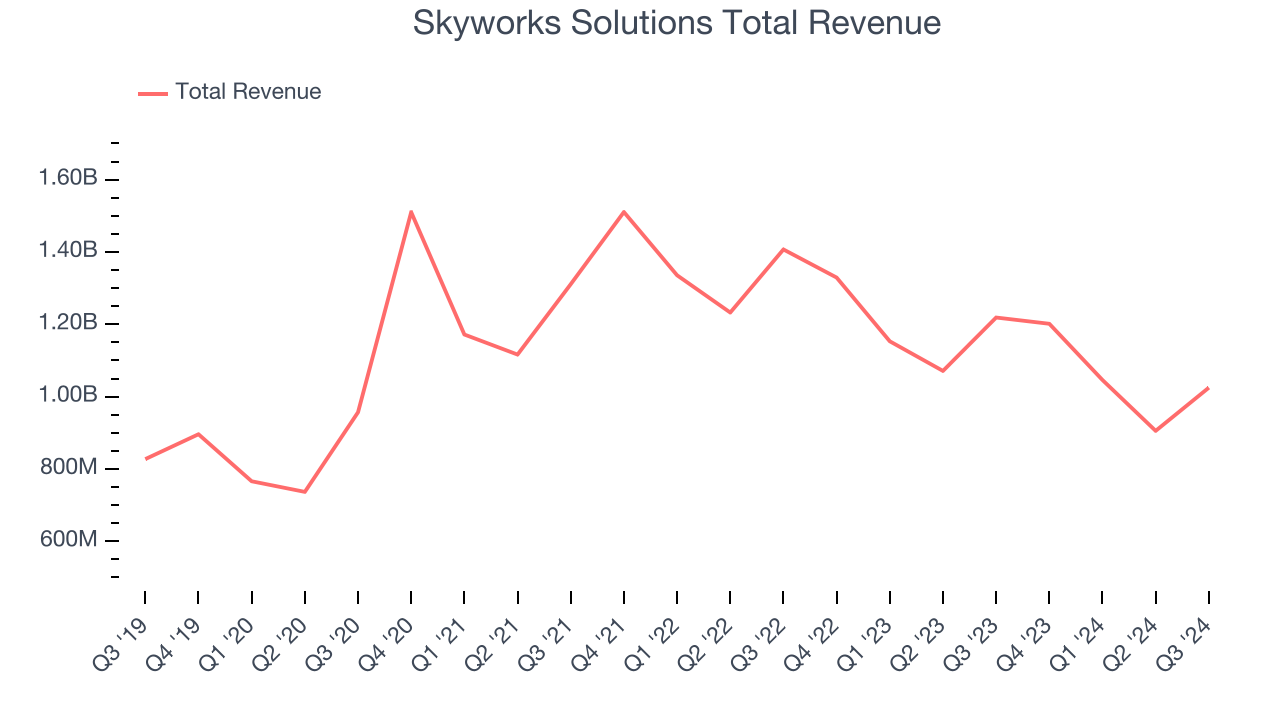
We at StockStory place the most emphasis on long-term growth, but within semiconductors, a half-decade historical view may miss new demand cycles or industry trends like AI. Skyworks Solutions’s history shows it grew in the past but relinquished its gains over the last two years, as its revenue fell by 12.7% annually. 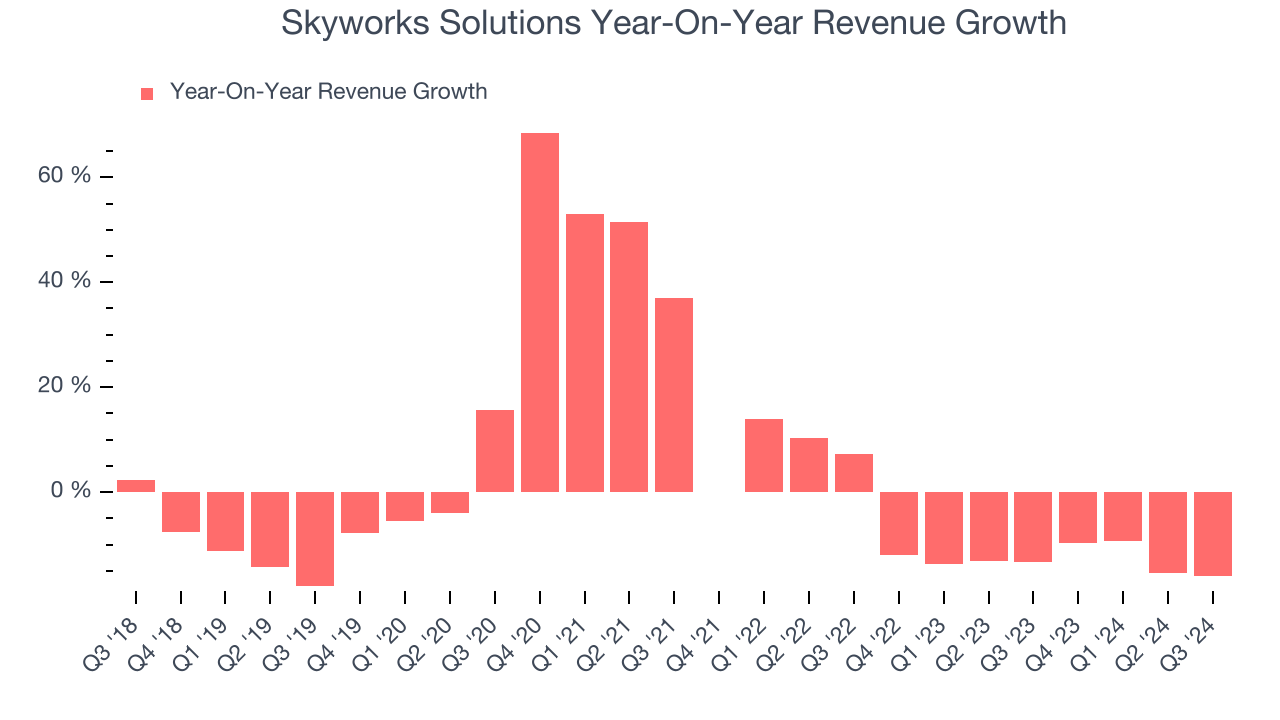
This quarter, Skyworks Solutions reported a rather uninspiring 15.9% year-on-year revenue decline to $1.02 billion of revenue, in line with Wall Street’s estimates. Company management is currently guiding for a 11.4% year-on-year decline next quarter.
Looking further ahead, sell-side analysts expect revenue to remain flat over the next 12 months, an improvement versus the last two years. While this projection indicates its newer products and services will catalyze better performance, it is still below average for the sector.
When a company has more cash than it knows what to do with, buying back its own shares can make a lot of sense–as long as the price is right. Luckily, we’ve found one, a low-priced stock that is gushing free cash flow AND buying back shares. Click here to claim your Special Free Report on a fallen angel growth story that is already recovering from a setback.
Product Demand & Outstanding Inventory
Days Inventory Outstanding (DIO) is an important metric for chipmakers, as it reflects a business’ capital intensity and the cyclical nature of semiconductor supply and demand. In a tight supply environment, inventories tend to be stable, allowing chipmakers to exert pricing power. Steadily increasing DIO can be a warning sign that demand is weak, and if inventories continue to rise, the company may have to downsize production.
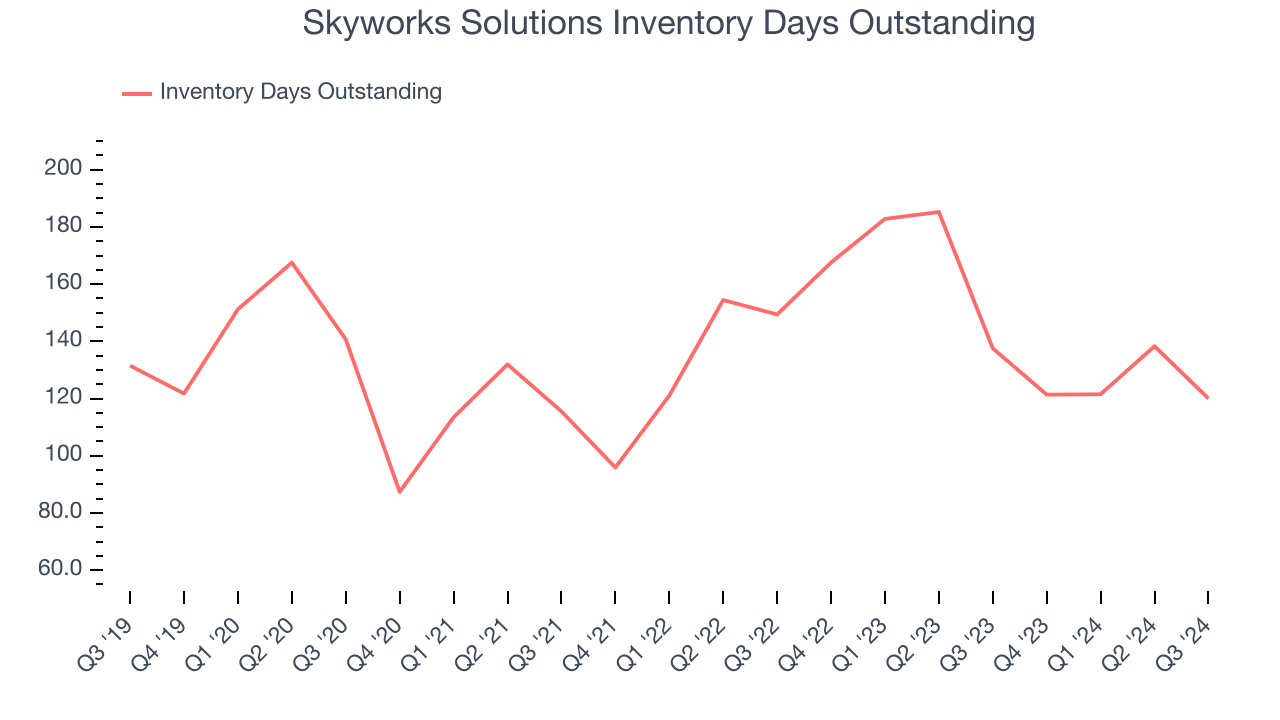
This quarter, Skyworks Solutions’s DIO came in at 120, which is 16 days below its five-year average. At the moment, these numbers show no indication of an excessive inventory buildup.
Key Takeaways from Skyworks Solutions’s Q3 Results
We were impressed by Skyworks Solutions’s strong improvement in gross margin and inventory levels this quarter. We were also glad its EPS beat analysts' expectations. On the other hand, its revenue and EPS guidance for next quarter fell short, making it a mixed quarter. The stock traded up 1% to $87.99 immediately after reporting.
So do we think Skyworks Solutions is an attractive buy at the current price? If you’re making that decision, you should consider the bigger picture of valuation, business qualities, as well as the latest earnings. We cover that in our actionable full research report which you can read here, it’s free.