Leading edge card issuer Marqeta (NASDAQ: MQ) met Wall Street’s revenue expectations in Q3 CY2024, with sales up 17.5% year on year to $128 million. On the other hand, next quarter’s revenue guidance of $120.9 million was less impressive, coming in 13.1% below analysts’ estimates. Its GAAP loss of $0.06 per share was 11.9% below analysts’ consensus estimates.
Is now the time to buy Marqeta? Find out by accessing our full research report, it’s free.
Marqeta (MQ) Q3 CY2024 Highlights:
- Revenue: $128 million vs analyst estimates of $128.2 million (in line)
- EPS: -$0.06 vs analyst expectations of -$0.05 (11.9% miss)
- EBITDA: $9.02 billion vs analyst estimates of $6.47 million (139,327% beat)
- Revenue Guidance for Q4 CY2024 is $120.9 million at the midpoint, below analyst estimates of $139.1 million
- Gross Margin (GAAP): 70.4%, up from 66.6% in the same quarter last year
- Operating Margin: -33%, up from -64.1% in the same quarter last year
- EBITDA Margin: 7,048%, up from -1.9% in the same quarter last year
- Free Cash Flow Margin: 2.3%, down from 19.7% in the previous quarter
- Market Capitalization: $2.97 billion
"In the third quarter our true growth trajectory was back on display as we lapped the Block contract renewal, while continuing to demonstrate operational discipline to fuel strong Adjusted EBITDA. We combined this with several new product announcements that further enhance the Marqeta platform to provide transformative payment solutions at scale for our expanding customer base,” said Simon Khalaf, CEO at Marqeta.
Company Overview
Founded by CEO Jason Gardner in 2009, Marqeta (NASDAQ: MQ) is an innovative card issuer that provides companies with the ability to issue and process virtual, physical, and tokenized credit and debit cards.
Payments Software
Consumers want the ability to make payments whenever and wherever they prefer – and to do so without having to worry about fraud or other security threats. However, building payments infrastructure from scratch is extremely resource-intensive for engineering teams. That drives demand for payments platforms that are easy to integrate into consumer applications and websites.
Sales Growth
A company’s long-term performance can indicate its business quality. Any business can put up a good quarter or two, but many enduring ones grow for years. Regrettably, Marqeta’s sales grew at a weak 2.9% compounded annual growth rate over the last three years. This shows it failed to expand in any major way, a rough starting point for our analysis.
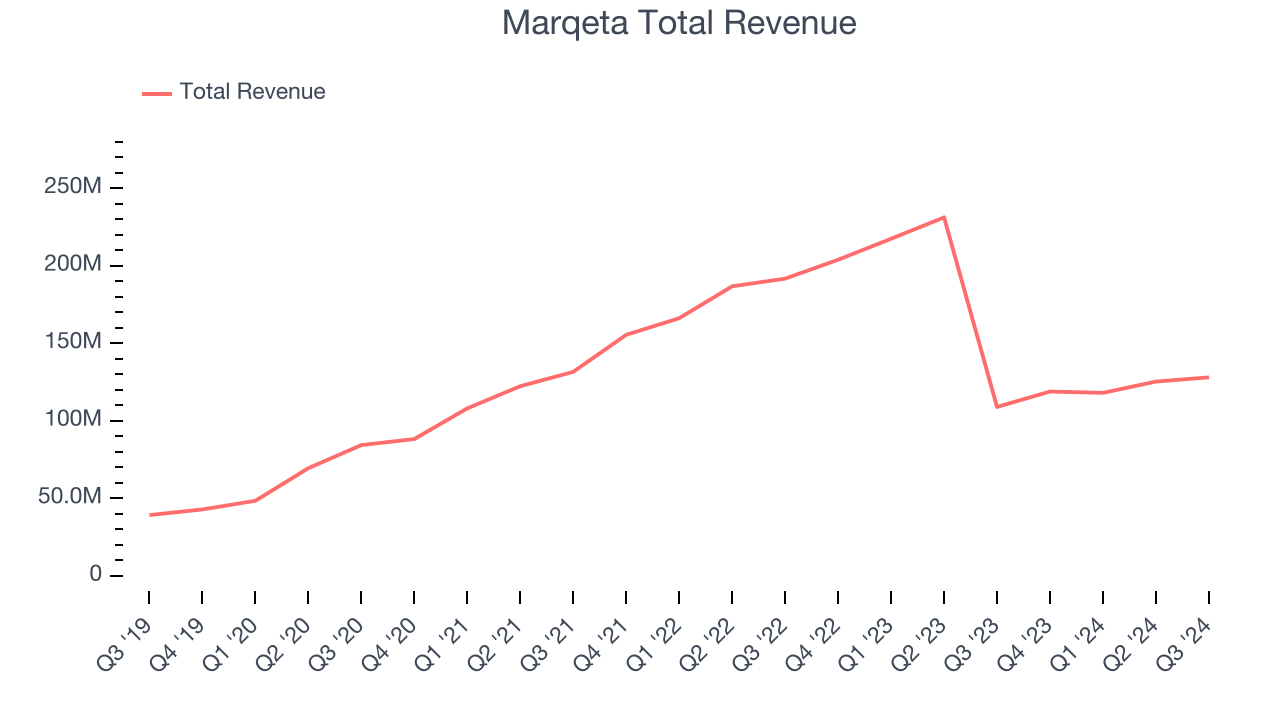
This quarter, Marqeta’s year-on-year revenue growth was 17.5%, and its $128 million of revenue was in line with Wall Street’s estimates. Management is currently guiding for a 1.7% year-on-year increase next quarter.
Looking further ahead, sell-side analysts expect revenue to grow 23.1% over the next 12 months, an acceleration versus the last three years. This projection is healthy and indicates the market thinks its newer products and services will catalyze higher growth rates.
When a company has more cash than it knows what to do with, buying back its own shares can make a lot of sense–as long as the price is right. Luckily, we’ve found one, a low-priced stock that is gushing free cash flow AND buying back shares. Click here to claim your Special Free Report on a fallen angel growth story that is already recovering from a setback.
Total Payment Volume
In addition to reported revenue, it is useful to analyze TPV, or total processing volumes, for Marqeta. That’s because TPV accounts for the aggregate dollar value processed by Marqeta’s platform, and the company generates revenue by taking a cut of the TPV.
Over the last year, Marqeta’s TPV growth has been fantastic, averaging 32% year-on-year increases and punching in at $73.9 billion in the latest quarter. This alternate topline metric has been growing faster than revenue, which could mean that take rates have declined. However, we can’t automatically assume the company is reducing its fees because take rates can also vary depending on the type of products sold on its platform. 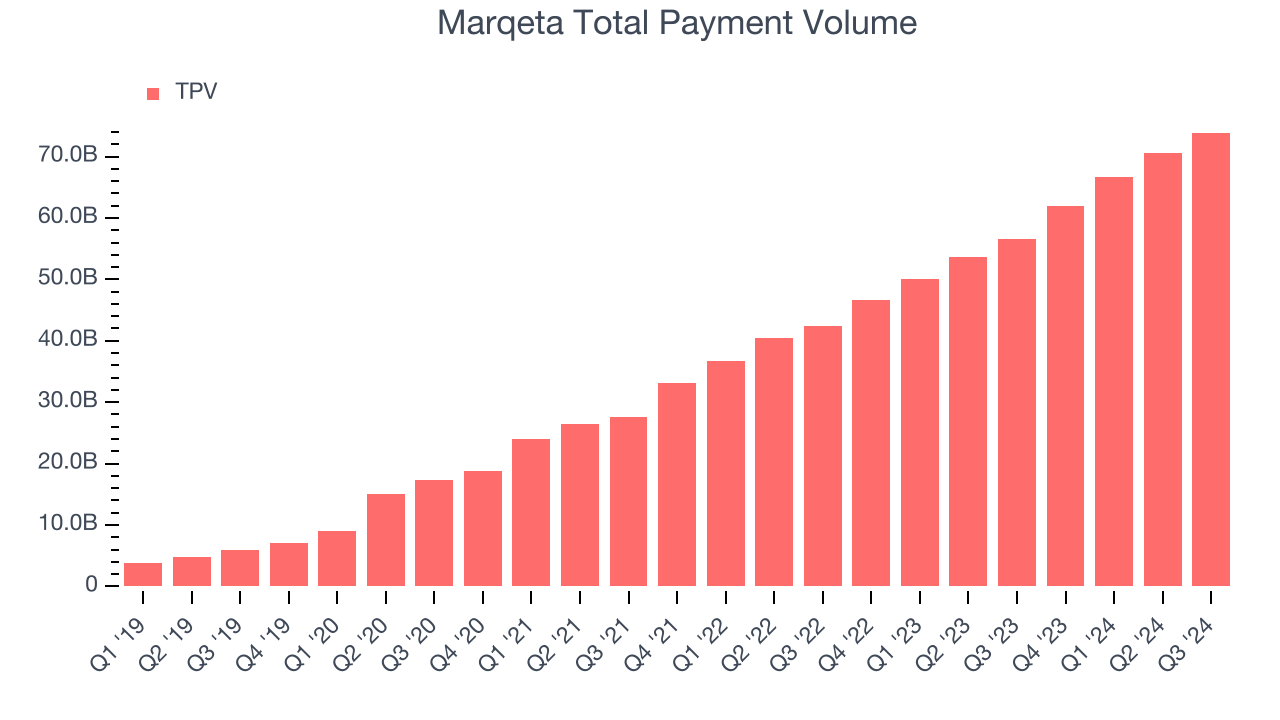
Customer Acquisition Efficiency
Customer acquisition cost (CAC) payback represents the months required to recover the cost of acquiring a new customer. Essentially, it’s the break-even point for marketing and sales investments. A shorter CAC payback period is ideal, as it implies better returns on investment and business scalability.
It’s very expensive for Marqeta to acquire new customers as its CAC payback period checked in at -1.1 months this quarter. The company’s inefficiency indicates a highly competitive environment with little differentiation between Marqeta’s products and its peers.
Key Takeaways from Marqeta’s Q3 Results
It was good to see Marqeta's EBITDA top estimates, but that's where the good news ends - its EPS missed and its revenue guidance for next quarter underwhelmed significantly. This quarter had some blemishes, and the stock traded down 33.2% to $3.99 immediately after reporting.
Should you buy the stock or not? If you’re making that decision, you should consider the bigger picture of valuation, business qualities, as well as the latest earnings. We cover that in our actionable full research report which you can read here, it’s free.