Bloomin' Brands has gotten torched over the last six months - since June 2024, its stock price has dropped 33% to $13 per share. This was partly due to its softer quarterly results and might have investors contemplating their next move.
Is there a buying opportunity in Bloomin' Brands, or does it present a risk to your portfolio? Dive into our full research report to see our analyst team’s opinion, it’s free.Despite the more favorable entry price, we're swiping left on Bloomin' Brands for now. Here are three reasons why you should be careful with BLMN and a stock we'd rather own.
Why Do We Think Bloomin' Brands Will Underperform?
Owner of the iconic Australian-themed Outback Steakhouse, Bloomin’ Brands (NASDAQ: BLMN) is a leading American restaurant company that owns and operates a portfolio of popular restaurant brands.
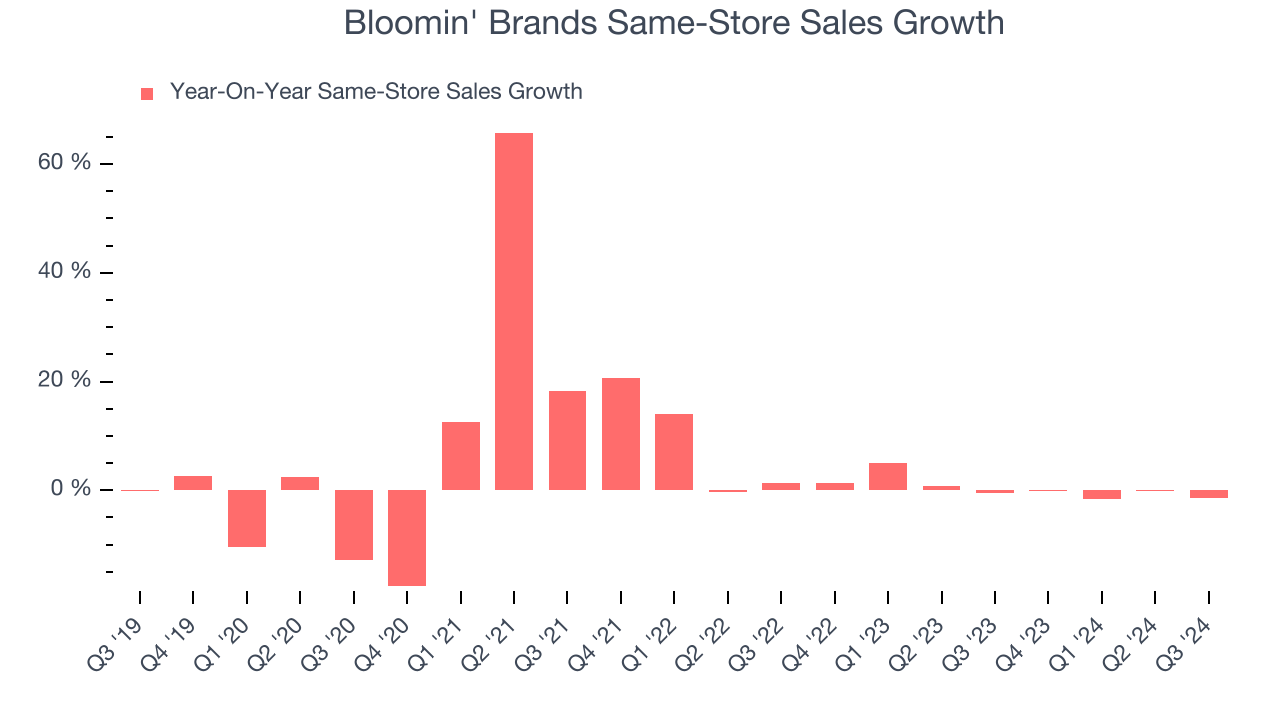
1. Flat Same-Store Sales Indicate Weak Demand
Same-store sales show the change in sales at restaurants open for at least a year. This is a key performance indicator because it measures organic growth.
Bloomin' Brands’s demand within its existing dining locations has barely increased over the last two years as its same-store sales were flat.
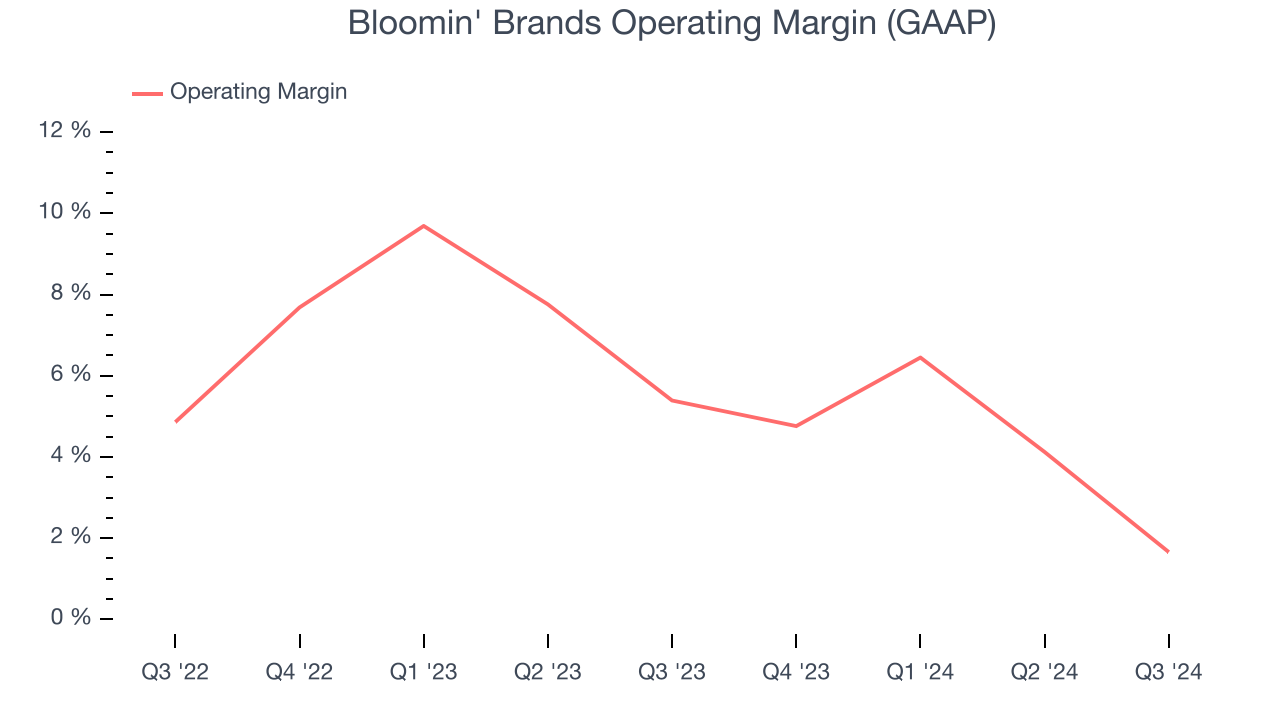
2. Operating Margin Falling
Operating margin is a key profitability metric because it accounts for all expenses keeping the lights on, including wages, rent, advertising, and other administrative costs.
Analyzing the trend in its profitability, Bloomin' Brands’s operating margin decreased by 3.4 percentage points over the last year. The company’s performance was poor no matter how you look at it. It shows operating expenses were rising and it couldn’t pass those costs onto its customers. Its operating margin for the trailing 12 months was 4.3%.
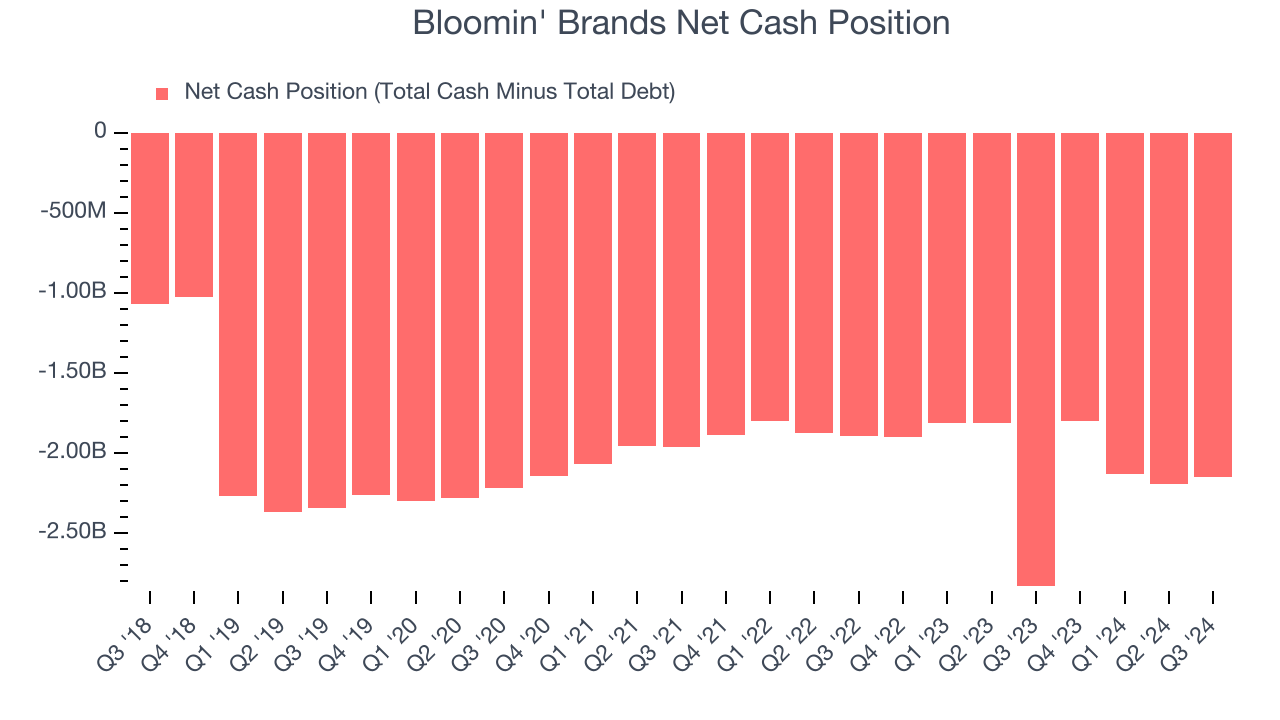
3. Short Cash Runway Exposes Shareholders to Potential Dilution
As long-term investors, the risk we care about most is the permanent loss of capital, which can happen when a company goes bankrupt or raises money from a disadvantaged position. This is separate from short-term stock price volatility, something we are much less bothered by.
Bloomin' Brands burned through $28.59 million of cash over the last year, and its $2.23 billion of debt exceeds the $83.63 million of cash on its balance sheet. This is a deal breaker for us because indebted loss-making companies spell trouble.
Unless the Bloomin' Brands’s fundamentals change quickly, it might find itself in a position where it must raise capital from investors to continue operating. Whether that would be favorable is unclear because dilution is a headwind for shareholder returns.
We remain cautious of Bloomin' Brands until it generates consistent free cash flow or any of its announced financing plans materialize on its balance sheet.
Final Judgment
Bloomin' Brands falls short of our quality standards. Following the recent decline, the stock trades at 5.7× forward price-to-earnings (or $13 per share). While this valuation is optically cheap, the potential downside is huge given its shaky fundamentals. There are better stocks to buy right now. We’d recommend looking at ServiceNow, one of our all-time favorite software stocks with a durable competitive moat.
Stocks We Like More Than Bloomin' Brands
The Trump trade may have passed, but rates are still dropping and inflation is still cooling. Opportunities are ripe for those ready to act - and we’re here to help you pick them.
Get started by checking out our Top 9 Market-Beating Stocks. This is a curated list of our High Quality stocks that have generated a market-beating return of 175% over the last five years.
Stocks that made our list in 2019 include now familiar names such as Nvidia (+2,691% between September 2019 and September 2024) as well as under-the-radar businesses like Comfort Systems (+783% five-year return). Find your next big winner with StockStory today for free.