
Looking back on apparel and accessories stocks’ Q2 earnings, we examine this quarter’s best and worst performers, including PVH (NYSE: PVH) and its peers.
Thanks to social media and the internet, not only are styles changing more frequently today than in decades past but also consumers are shifting the way they buy their goods, favoring omnichannel and e-commerce experiences. Some apparel and accessories companies have made concerted efforts to adapt while those who are slower to move may fall behind.
The 17 apparel and accessories stocks we track reported a strong Q2. As a group, revenues beat analysts’ consensus estimates by 2.9% while next quarter’s revenue guidance was 13% below.
In light of this news, share prices of the companies have held steady as they are up 3.6% on average since the latest earnings results.
PVH (NYSE: PVH)
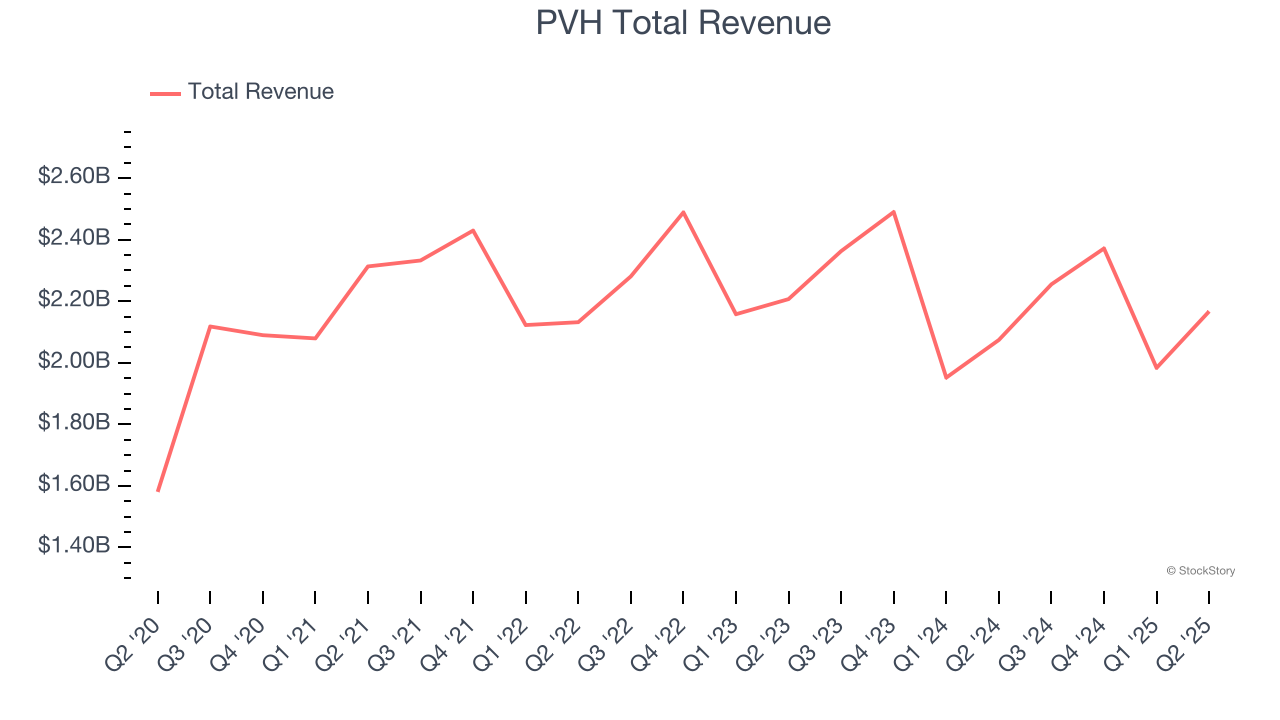
Founded in 1881 by a husband and wife duo, PVH (NYSE: PVH) is a global fashion conglomerate with iconic brands like Calvin Klein and Tommy Hilfiger.
PVH reported revenues of $2.17 billion, up 4.5% year on year. This print exceeded analysts’ expectations by 2.3%. Overall, it was a strong quarter for the company with a solid beat of analysts’ adjusted operating income estimates and a beat of analysts’ EPS estimates.
Interestingly, the stock is up 2.2% since reporting and currently trades at $84.32.
Is now the time to buy PVH? Access our full analysis of the earnings results here, it’s free for active Edge members.
Best Q2: Figs (NYSE: FIGS)
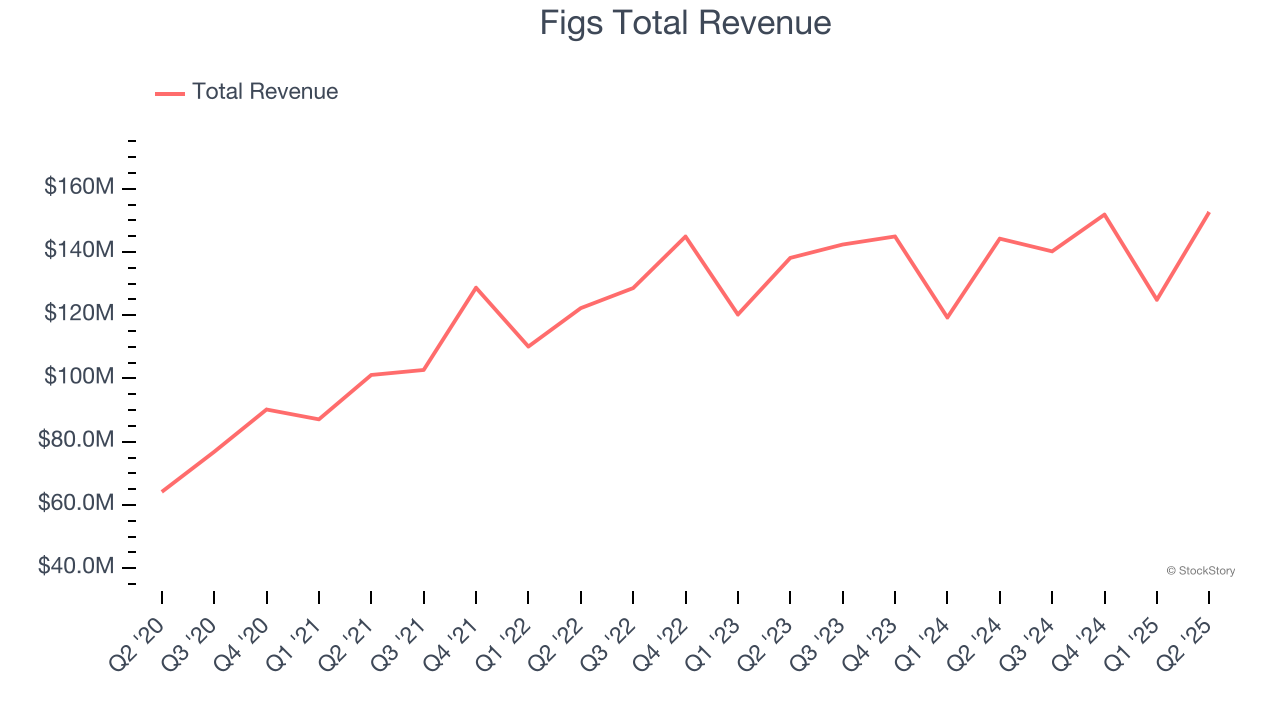
Rising to fame via TikTok and founded in 2013 by Heather Hasson and Trina Spear, Figs (NYSE: FIGS) is a healthcare apparel company known for its stylish approach to medical attire and uniforms.
Figs reported revenues of $152.6 million, up 5.8% year on year, outperforming analysts’ expectations by 5.5%. The business had a stunning quarter with a beat of analysts’ EPS and EBITDA estimates.
The market seems happy with the results as the stock is up 10.8% since reporting. It currently trades at $7.27.
Is now the time to buy Figs? Access our full analysis of the earnings results here, it’s free for active Edge members.
Weakest Q2: Carter's (NYSE: CRI)
Rumored to sell more than 10 products for every child born in the United States, Carter's (NYSE: CRI) is an American designer and marketer of children's apparel.
Carter's reported revenues of $585.3 million, up 3.7% year on year, exceeding analysts’ expectations by 3.4%. Still, it was a softer quarter as it posted a significant miss of analysts’ adjusted operating income estimates.
As expected, the stock is down 4.7% since the results and currently trades at $31.18.
Read our full analysis of Carter’s results here.
Tapestry (NYSE: TPR)
Originally founded as Coach, Tapestry (NYSE: TPR) is an American fashion conglomerate with a portfolio of luxury brands offering high-quality accessories and fashion products.
Tapestry reported revenues of $1.72 billion, up 8.3% year on year. This print topped analysts’ expectations by 2.6%. Zooming out, it was a mixed quarter as it also logged an impressive beat of analysts’ constant currency revenue estimates but a significant miss of analysts’ EPS estimates.
Tapestry had the weakest full-year guidance update among its peers. The stock is up 2.4% since reporting and currently trades at $116.26.
Read our full, actionable report on Tapestry here, it’s free for active Edge members.
Oxford Industries (NYSE: OXM)
The parent company of Tommy Bahama, Oxford Industries (NYSE: OXM) is a lifestyle fashion conglomerate with brands that embody outdoor happiness.
Oxford Industries reported revenues of $403.1 million, down 4% year on year. This number lagged analysts' expectations by 0.7%. More broadly, it was a mixed quarter as it also produced full-year EPS guidance beating analysts’ expectations but EPS guidance for next quarter missing analysts’ expectations.
Oxford Industries had the weakest performance against analyst estimates among its peers. The stock is down 7.2% since reporting and currently trades at $37.52.
Read our full, actionable report on Oxford Industries here, it’s free for active Edge members.
Market Update
As a result of the Fed’s rate hikes in 2022 and 2023, inflation has come down from frothy levels post-pandemic. The general rise in the price of goods and services is trending towards the Fed’s 2% goal as of late, which is good news. The higher rates that fought inflation also didn't slow economic activity enough to catalyze a recession. So far, soft landing. This, combined with recent rate cuts (half a percent in September 2024 and a quarter percent in November 2024) have led to strong stock market performance in 2024. The icing on the cake for 2024 returns was Donald Trump’s victory in the U.S. Presidential Election in early November, sending major indices to all-time highs in the week following the election. Still, debates around the health of the economy and the impact of potential tariffs and corporate tax cuts remain, leaving much uncertainty around 2025.
Want to invest in winners with rock-solid fundamentals? Check out our 9 Best Market-Beating Stocks and add them to your watchlist. These companies are poised for growth regardless of the political or macroeconomic climate.
StockStory is growing and hiring equity analyst and marketing roles. Are you a 0 to 1 builder passionate about the markets and AI? See the open roles here.


