
U.S. Physical Therapy has followed the market’s trajectory closely, rising in tandem with the S&P 500 over the past six months. The stock has climbed by 35.2% to $89.62 per share while the index has gained 30.6%.
Is now the time to buy U.S. Physical Therapy, or should you be careful about including it in your portfolio? Dive into our full research report to see our analyst team’s opinion, it’s free for active Edge members.
Why Is U.S. Physical Therapy Not Exciting?
We're cautious about U.S. Physical Therapy. Here are three reasons there are better opportunities than USPH and a stock we'd rather own.
1. Fewer Distribution Channels Limit its Ceiling
Larger companies benefit from economies of scale, where fixed costs like infrastructure, technology, and administration are spread over a higher volume of goods or services, reducing the cost per unit. Scale can also lead to bargaining power with suppliers, greater brand recognition, and more investment firepower. A virtuous cycle can ensue if a scaled company plays its cards right.
With just $729.6 million in revenue over the past 12 months, U.S. Physical Therapy is a small company in an industry where scale matters. This makes it difficult to build trust with customers because healthcare is heavily regulated, complex, and resource-intensive.
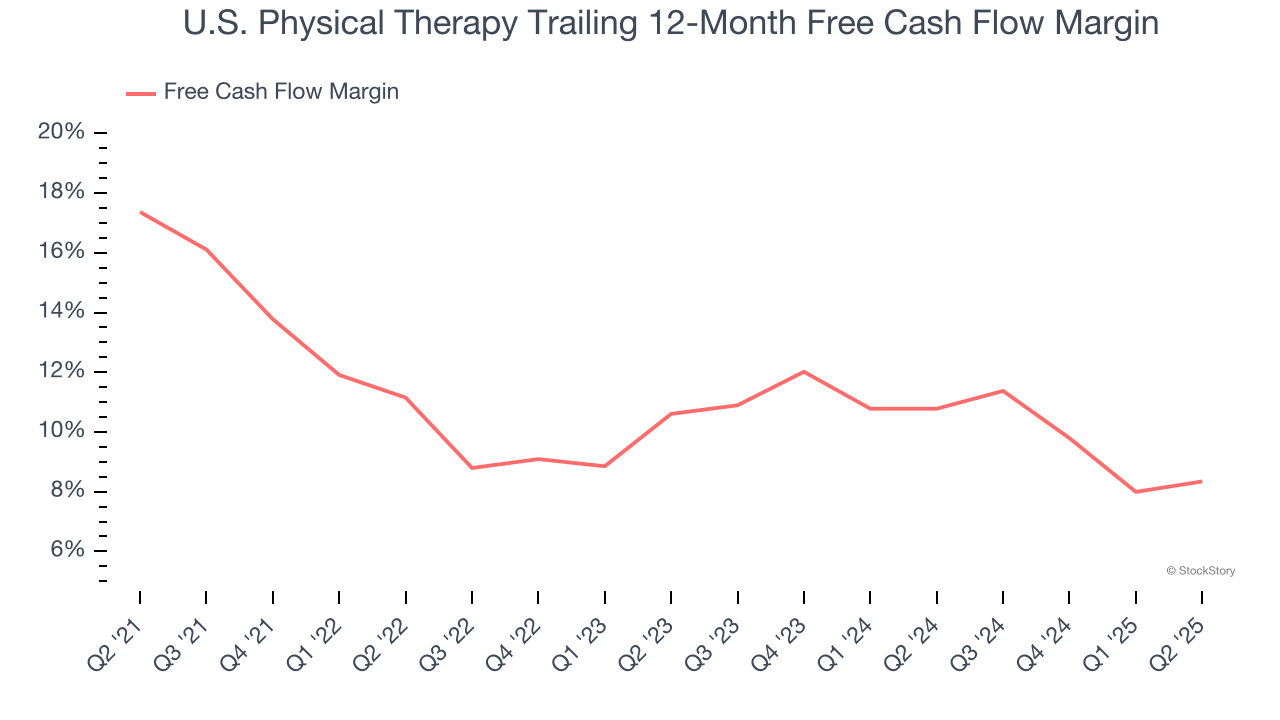
2. Free Cash Flow Margin Dropping
If you’ve followed StockStory for a while, you know we emphasize free cash flow. Why, you ask? We believe that in the end, cash is king, and you can’t use accounting profits to pay the bills.
As you can see below, U.S. Physical Therapy’s margin dropped by 9 percentage points over the last five years. If its declines continue, it could signal increasing investment needs and capital intensity. U.S. Physical Therapy’s free cash flow margin for the trailing 12 months was 8.3%.
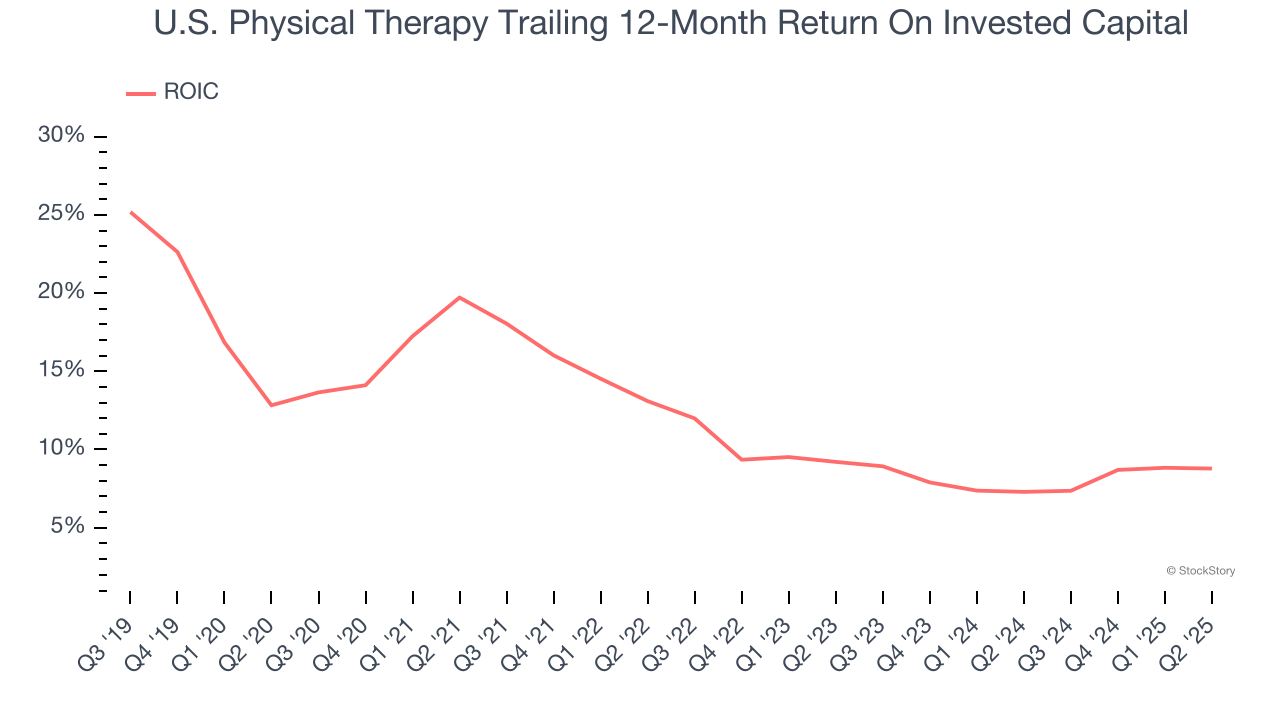
3. New Investments Fail to Bear Fruit as ROIC Declines
ROIC, or return on invested capital, is a metric showing how much operating profit a company generates relative to the money it has raised (debt and equity).
We like to invest in businesses with high returns, but the trend in a company’s ROIC is what often surprises the market and moves the stock price. Unfortunately, U.S. Physical Therapy’s ROIC has decreased over the last few years. We like what management has done in the past, but its declining returns are perhaps a symptom of fewer profitable growth opportunities.
Final Judgment
U.S. Physical Therapy isn’t a terrible business, but it doesn’t pass our bar. That said, the stock currently trades at 32.1× forward P/E (or $89.62 per share). This valuation tells us it’s a bit of a market darling with a lot of good news priced in - we think other companies feature superior fundamentals at the moment. We’d recommend looking at a fast-growing restaurant franchise with an A+ ranch dressing sauce.
Stocks We Would Buy Instead of U.S. Physical Therapy
Donald Trump’s April 2025 "Liberation Day" tariffs sent markets into a tailspin, but stocks have since rebounded strongly, proving that knee-jerk reactions often create the best buying opportunities.
The smart money is already positioning for the next leg up. Don’t miss out on the recovery - check out our Top 5 Strong Momentum Stocks for this week. This is a curated list of our High Quality stocks that have generated a market-beating return of 183% over the last five years (as of March 31st 2025).
Stocks that made our list in 2020 include now familiar names such as Nvidia (+1,545% between March 2020 and March 2025) as well as under-the-radar businesses like the once-small-cap company Exlservice (+354% five-year return). Find your next big winner with StockStory today.
StockStory is growing and hiring equity analyst and marketing roles. Are you a 0 to 1 builder passionate about the markets and AI? See the open roles here.


