
Regional banking company Community Financial System (NYSE: CBU) met Wall Street’s revenue expectations in Q3 CY2025, with sales up 9.6% year on year to $207.1 million. Its non-GAAP profit of $1.09 per share was 4.1% above analysts’ consensus estimates.
Is now the time to buy Community Bank? Find out by accessing our full research report, it’s free for active Edge members.
Community Bank (CBU) Q3 CY2025 Highlights:
- Net Interest Income: $128.2 million vs analyst estimates of $130.1 million (13.7% year-on-year growth, 1.5% miss)
- Net Interest Margin: 3.3% vs analyst estimates of 3.3% (4 basis point miss)
- Revenue: $207.1 million vs analyst estimates of $207.4 million (9.6% year-on-year growth, in line)
- Efficiency Ratio: 62% vs analyst estimates of 63% (96.7 basis point beat)
- Adjusted EPS: $1.09 vs analyst estimates of $1.05 (4.1% beat)
- Tangible Book Value per Share: $20.57 vs analyst estimates of $19.69 (22.2% year-on-year growth, 4.5% beat)
- Market Capitalization: $2.96 billion
Company Overview
Tracing its roots back to 1866 in upstate New York, Community Financial System (NYSE: CBU) is a financial holding company that provides banking, employee benefits, wealth management, and insurance services to retail, commercial, and municipal customers.
Sales Growth
Net interest income and and fee-based revenue are the two pillars supporting bank earnings. The former captures profit from the gap between lending rates and deposit costs, while the latter encompasses charges for banking services, credit products, wealth management, and trading activities. Luckily, Community Bank’s revenue grew at a decent 6% compounded annual growth rate over the last five years. Its growth was slightly above the average banking company and shows its offerings resonate with customers.
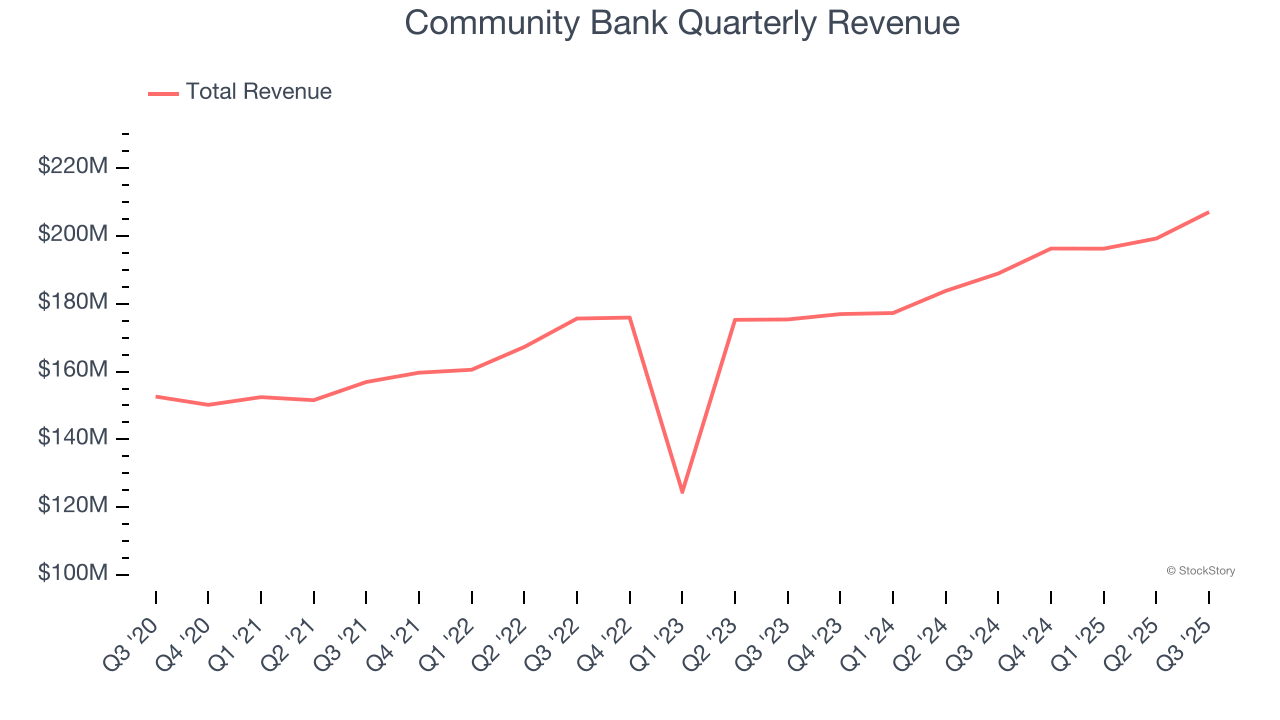
Long-term growth is the most important, but within financials, a half-decade historical view may miss recent interest rate changes and market returns. Community Bank’s annualized revenue growth of 10.8% over the last two years is above its five-year trend, suggesting its demand recently accelerated. 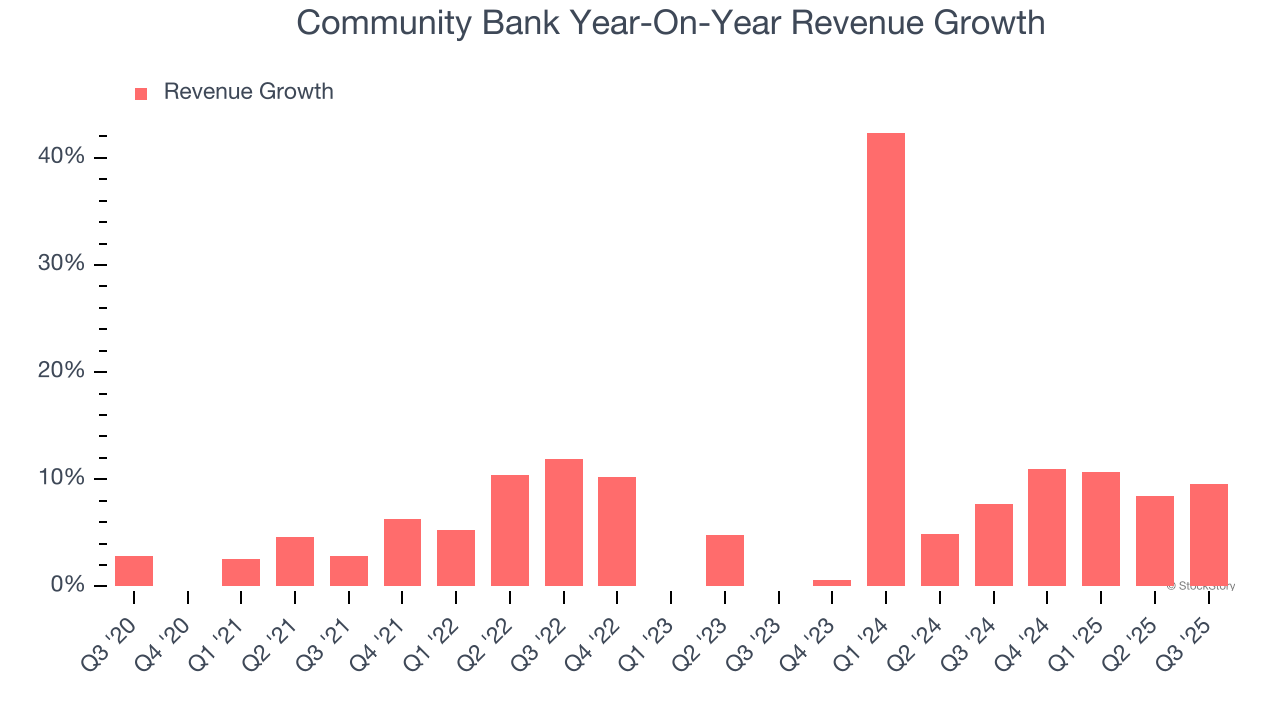 Note: Quarters not shown were determined to be outliers, impacted by outsized investment gains/losses that are not indicative of the recurring fundamentals of the business.
This quarter, Community Bank grew its revenue by 9.6% year on year, and its $207.1 million of revenue was in line with Wall Street’s estimates.
Net interest income made up 62.6% of the company’s total revenue during the last five years, meaning lending operations are Community Bank’s largest source of revenue.
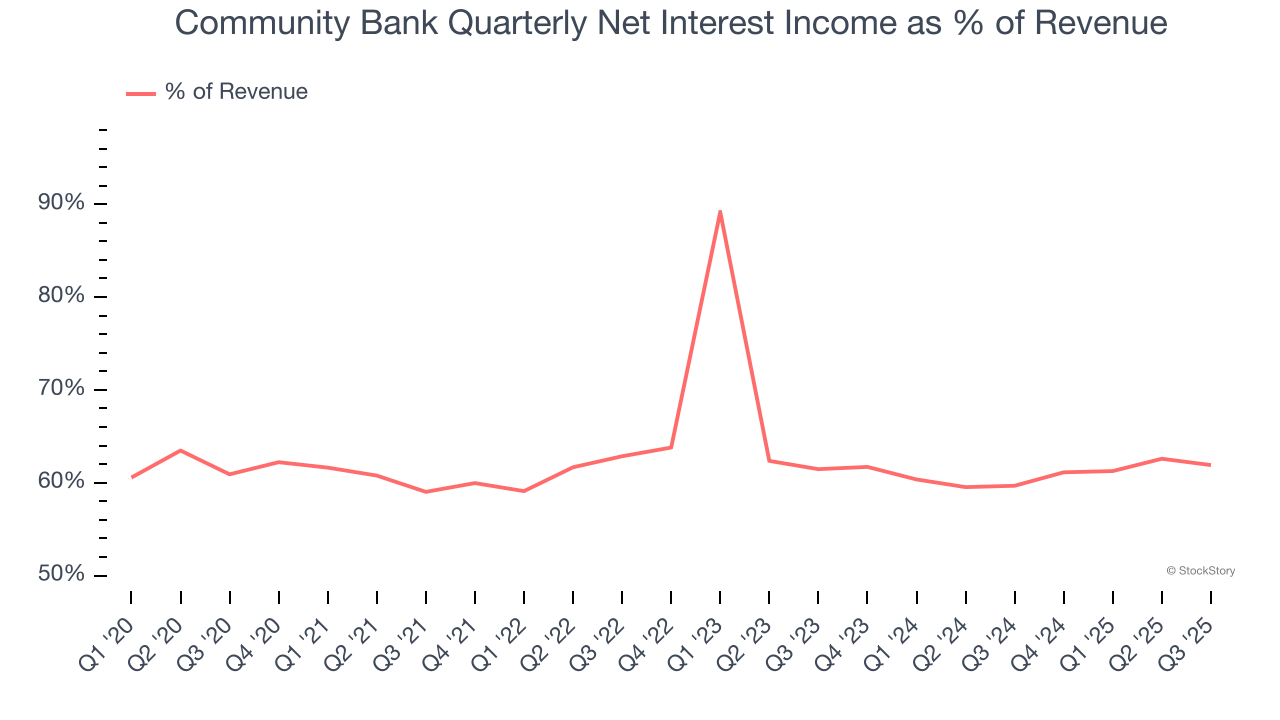
Net interest income commands greater market attention due to its reliability and consistency, whereas non-interest income is often seen as lower-quality revenue that lacks the same dependable characteristics.
Here at StockStory, we certainly understand the potential of thematic investing. Diverse winners from Microsoft (MSFT) to Alphabet (GOOG), Coca-Cola (KO) to Monster Beverage (MNST) could all have been identified as promising growth stories with a megatrend driving the growth. So, in that spirit, we’ve identified a relatively under-the-radar profitable growth stock benefiting from the rise of AI, available to you FREE via this link.
Tangible Book Value Per Share (TBVPS)
Banks operate as balance sheet businesses, with profits generated through borrowing and lending activities. Valuations reflect this reality, emphasizing balance sheet strength and long-term book value compounding ability.
When analyzing banks, tangible book value per share (TBVPS) takes precedence over many other metrics. This measure isolates genuine per-share value by removing intangible assets of debatable liquidation worth. On the other hand, EPS is often distorted by mergers and flexible loan loss accounting. TBVPS provides clearer performance insights.
Community Bank’s TBVPS declined at a 2.5% annual clip over the last five years. However, TBVPS growth has accelerated recently, growing by 29.7% annually over the last two years from $12.23 to $20.57 per share.
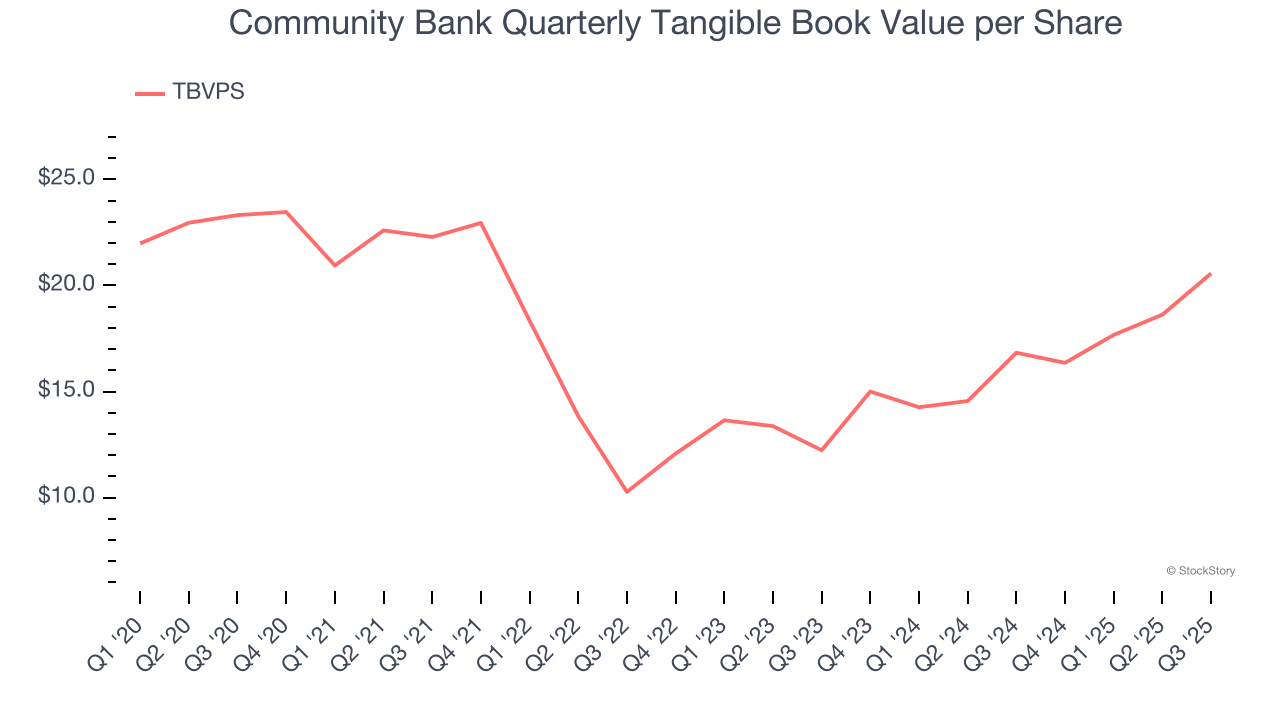
Over the next 12 months, Consensus estimates call for Community Bank’s TBVPS to grow by 12.1% to $23.06, top-notch growth rate.
Key Takeaways from Community Bank’s Q3 Results
We enjoyed seeing Community Bank beat analysts’ tangible book value per share expectations this quarter. On the other hand, its net interest income slightly missed. Overall, this quarter could have been better.
Is Community Bank an attractive investment opportunity right now? What happened in the latest quarter matters, but not as much as longer-term business quality and valuation, when deciding whether to invest in this stock. We cover that in our actionable full research report which you can read here, it’s free for active Edge members.


