Qorvo has been on fire lately. In the past six months alone, the company’s stock price has rocketed 58.1%, reaching $93.49 per share. This was partly thanks to its solid quarterly results, and the run-up might have investors contemplating their next move.
Is there a buying opportunity in Qorvo, or does it present a risk to your portfolio? Check out our in-depth research report to see what our analysts have to say, it’s free for active Edge members.
Why Do We Think Qorvo Will Underperform?
Despite the momentum, we're sitting this one out for now. Here are three reasons why QRVO doesn't excite us and a stock we'd rather own.
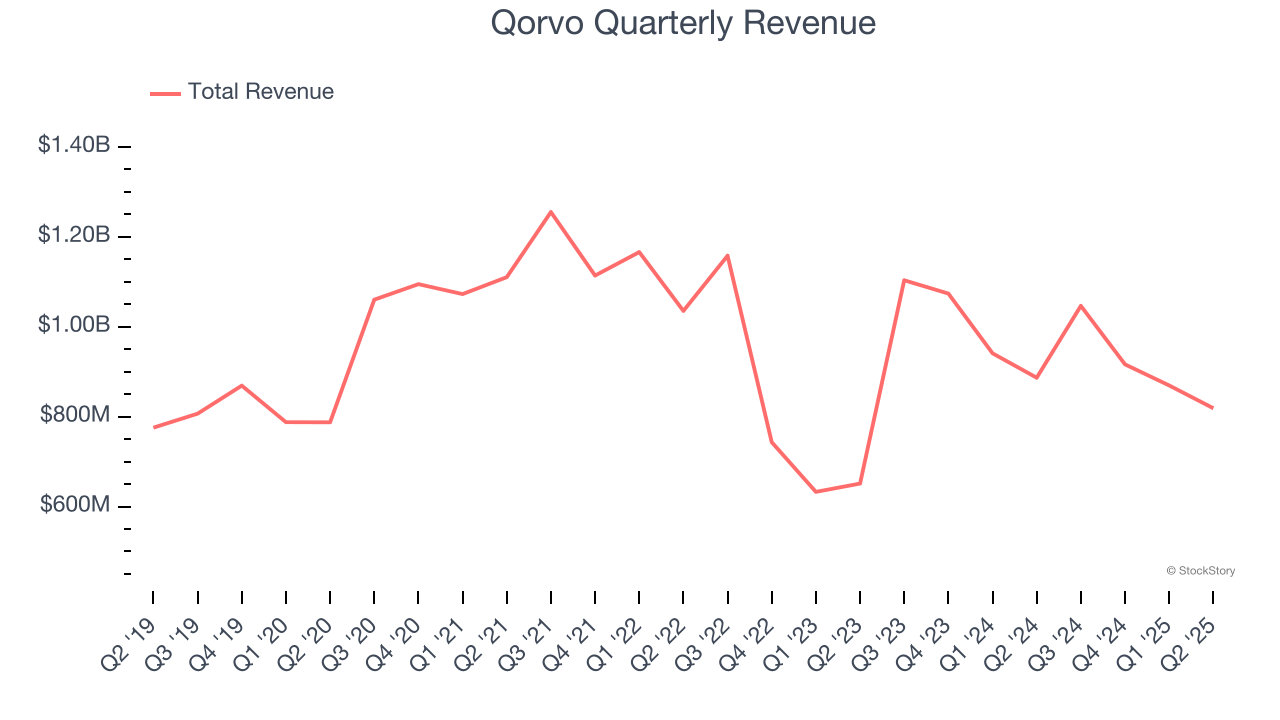
1. Long-Term Revenue Growth Disappoints
Examining a company’s long-term performance can provide clues about its quality. Any business can put up a good quarter or two, but many enduring ones grow for years. Over the last five years, Qorvo grew its sales at a tepid 2.3% compounded annual growth rate. This fell short of our benchmarks. Semiconductors are a cyclical industry, and long-term investors should be prepared for periods of high growth followed by periods of revenue contractions.
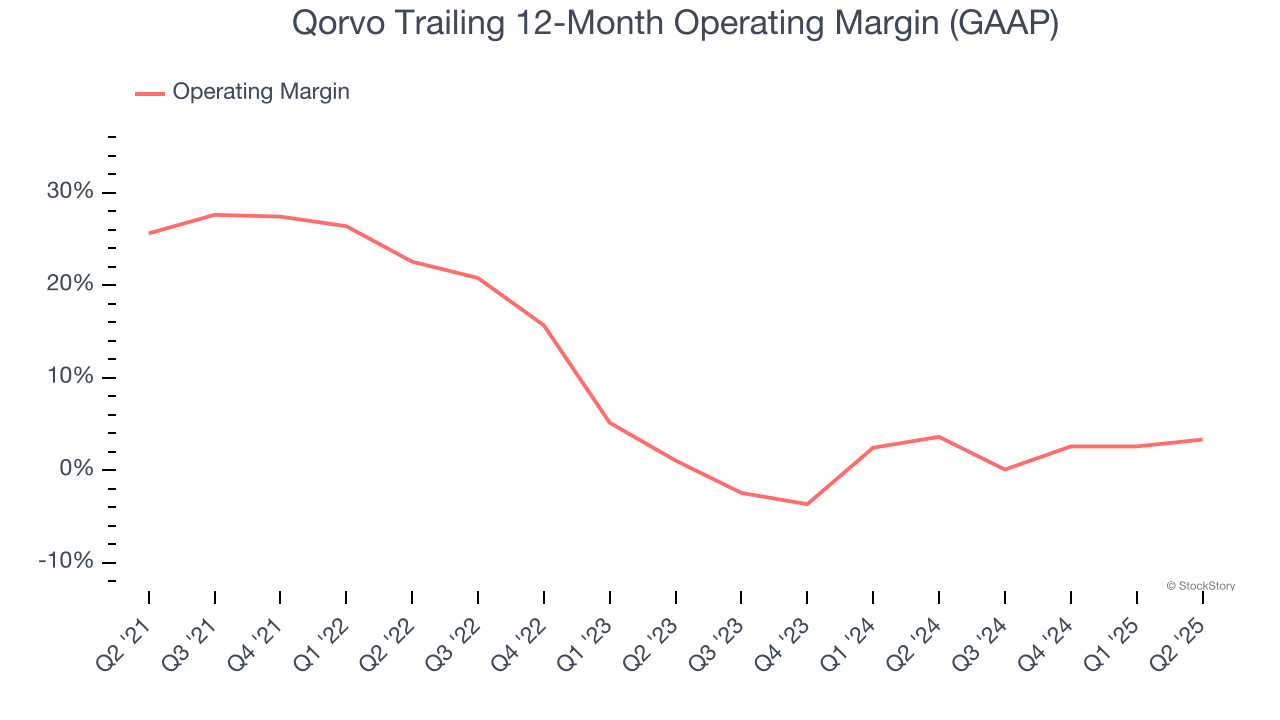
2. Shrinking Operating Margin
Operating margin is an important measure of profitability as it shows the portion of revenue left after accounting for all core expenses – everything from the cost of goods sold to advertising and wages. It’s also useful for comparing profitability across companies with different levels of debt and tax rates because it excludes interest and taxes.
Looking at the trend in its profitability, Qorvo’s operating margin decreased by 22.3 percentage points over the last five years. This raises questions about the company’s expense base because its revenue growth should have given it leverage on its fixed costs, resulting in better economies of scale and profitability. Qorvo’s performance was poor no matter how you look at it - it shows that costs were rising and it couldn’t pass them onto its customers. Its operating margin for the trailing 12 months was 3.3%.
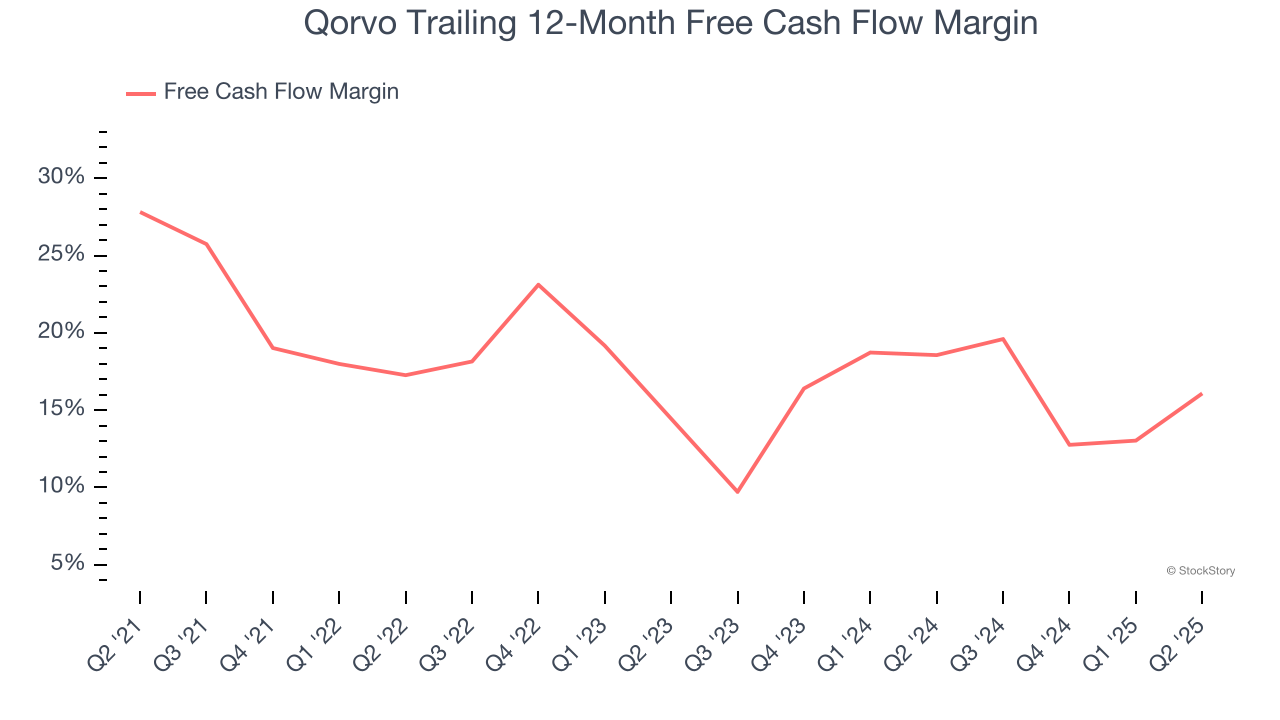
3. Free Cash Flow Margin Dropping
If you’ve followed StockStory for a while, you know we emphasize free cash flow. Why, you ask? We believe that in the end, cash is king, and you can’t use accounting profits to pay the bills.
As you can see below, Qorvo’s margin dropped by 11.7 percentage points over the last five years. Continued declines could signal it is in the middle of an investment cycle. Qorvo’s free cash flow margin for the trailing 12 months was 16.1%.
Final Judgment
Qorvo falls short of our quality standards. After the recent rally, the stock trades at 14.6× forward P/E (or $93.49 per share). This valuation tells us it’s a bit of a market darling with a lot of good news priced in - we think there are better opportunities elsewhere. Let us point you toward an all-weather company that owns household favorite Taco Bell.
High-Quality Stocks for All Market Conditions
Donald Trump’s April 2025 "Liberation Day" tariffs sent markets into a tailspin, but stocks have since rebounded strongly, proving that knee-jerk reactions often create the best buying opportunities.
The smart money is already positioning for the next leg up. Don’t miss out on the recovery - check out our Top 6 Stocks for this week. This is a curated list of our High Quality stocks that have generated a market-beating return of 183% over the last five years (as of March 31st 2025).
Stocks that made our list in 2020 include now familiar names such as Nvidia (+1,545% between March 2020 and March 2025) as well as under-the-radar businesses like the once-micro-cap company Kadant (+351% five-year return). Find your next big winner with StockStory today.
StockStory is growing and hiring equity analyst and marketing roles. Are you a 0 to 1 builder passionate about the markets and AI? See the open roles here.