MRC Global trades at $14 and has moved in lockstep with the market. Its shares have returned 25.7% over the last six months while the S&P 500 has gained 24.7%.
Is now the time to buy MRC Global, or should you be careful about including it in your portfolio? Get the full stock story straight from our expert analysts, it’s free for active Edge members.
Why Do We Think MRC Global Will Underperform?
We don't have much confidence in MRC Global. Here are three reasons we avoid MRC and a stock we'd rather own.
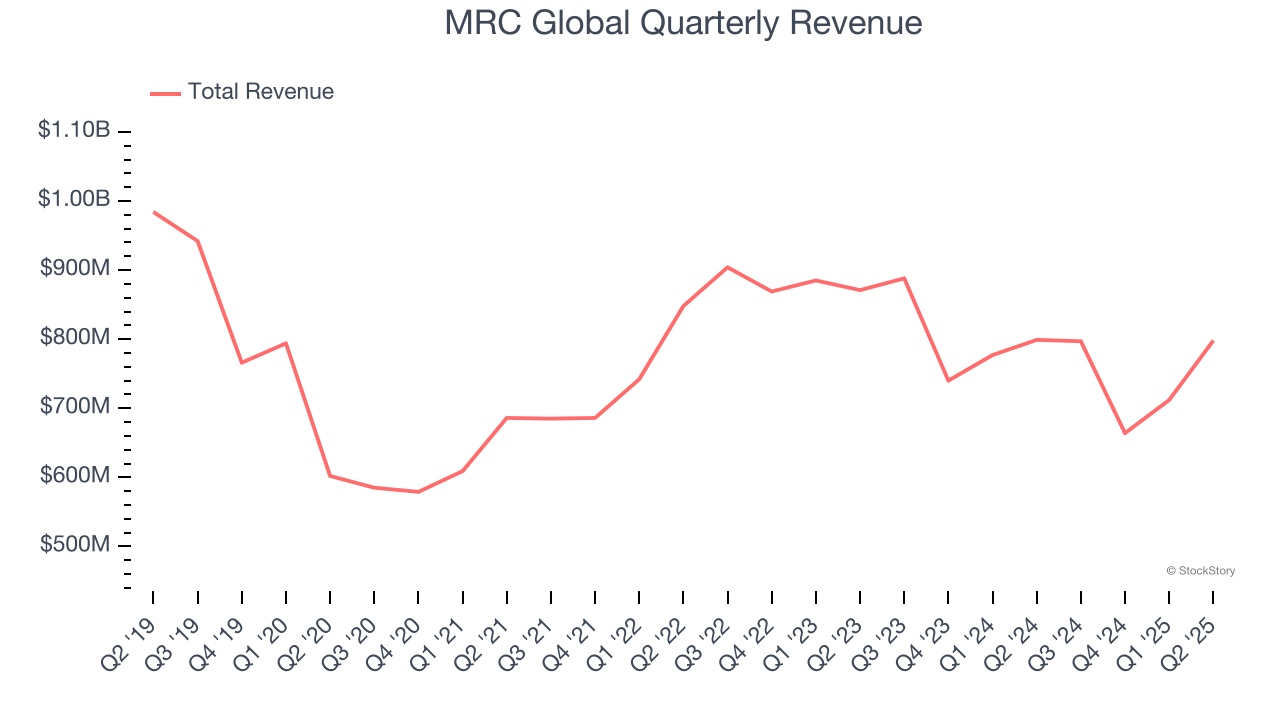
1. Long-Term Revenue Growth Flatter Than a Pancake
Reviewing a company’s long-term sales performance reveals insights into its quality. Any business can put up a good quarter or two, but many enduring ones grow for years. Unfortunately, MRC Global struggled to consistently increase demand as its $2.97 billion of sales for the trailing 12 months was close to its revenue five years ago. This was below our standards and is a sign of poor business quality.
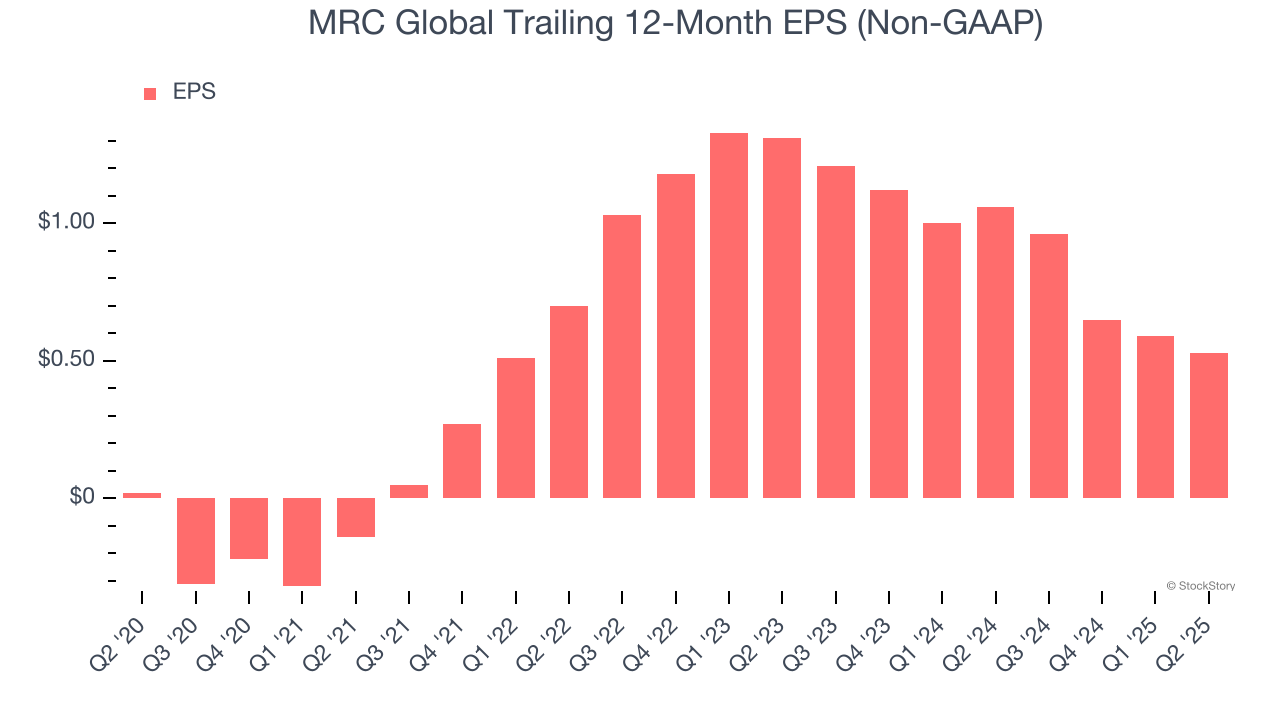
2. EPS Took a Dip Over the Last Two Years
Although long-term earnings trends give us the big picture, we like to analyze EPS over a shorter period to see if we are missing a change in the business.
Sadly for MRC Global, its EPS declined by more than its revenue over the last two years, dropping 36.4%. This tells us the company struggled to adjust to shrinking demand.
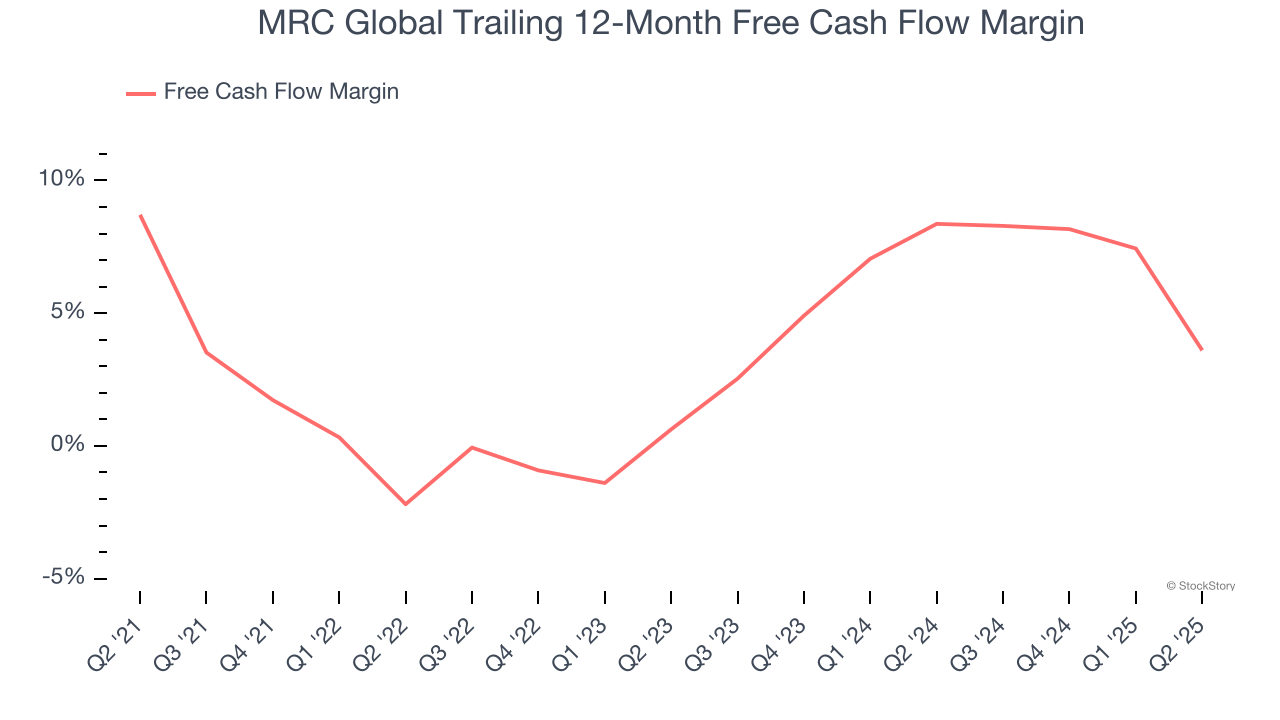
3. Free Cash Flow Margin Dropping
Free cash flow isn't a prominently featured metric in company financials and earnings releases, but we think it's telling because it accounts for all operating and capital expenses, making it tough to manipulate. Cash is king.
As you can see below, MRC Global’s margin dropped by 5.1 percentage points over the last five years. This along with its unexciting margin put the company in a tough spot, and shareholders are likely hoping it can reverse course. If the trend continues, it could signal it’s becoming a more capital-intensive business. MRC Global’s free cash flow margin for the trailing 12 months was 3.6%.
Final Judgment
We see the value of companies helping their customers, but in the case of MRC Global, we’re out. That said, the stock currently trades at 12.1× forward P/E (or $14 per share). This valuation multiple is fair, but we don’t have much confidence in the company. There are more exciting stocks to buy at the moment. We’d suggest looking at one of our top digital advertising picks.
Stocks We Would Buy Instead of MRC Global
Donald Trump’s April 2025 "Liberation Day" tariffs sent markets into a tailspin, but stocks have since rebounded strongly, proving that knee-jerk reactions often create the best buying opportunities.
The smart money is already positioning for the next leg up. Don’t miss out on the recovery - check out our Top 5 Strong Momentum Stocks for this week. This is a curated list of our High Quality stocks that have generated a market-beating return of 183% over the last five years (as of March 31st 2025).
Stocks that made our list in 2020 include now familiar names such as Nvidia (+1,545% between March 2020 and March 2025) as well as under-the-radar businesses like the once-small-cap company Exlservice (+354% five-year return). Find your next big winner with StockStory today.
StockStory is growing and hiring equity analyst and marketing roles. Are you a 0 to 1 builder passionate about the markets and AI? See the open roles here.