
The past six months have been a windfall for Hanesbrands’s shareholders. The company’s stock price has jumped 41.4%, hitting $6.86 per share. This was partly thanks to its solid quarterly results, and the performance may have investors wondering how to approach the situation.
Is there a buying opportunity in Hanesbrands, or does it present a risk to your portfolio? Get the full breakdown from our expert analysts, it’s free for active Edge members.
Why Do We Think Hanesbrands Will Underperform?
We’re glad investors have benefited from the price increase, but we're cautious about Hanesbrands. Here are three reasons there are better opportunities than HBI and a stock we'd rather own.
1. Declining Constant Currency Revenue, Demand Takes a Hit
In addition to reported revenue, constant currency revenue is a useful data point for analyzing Apparel and Accessories companies. This metric excludes currency movements, which are outside of Hanesbrands’s control and are not indicative of underlying demand.
Over the last two years, Hanesbrands’s constant currency revenue averaged 3.6% year-on-year declines. This performance was underwhelming and implies there may be increasing competition or market saturation. It also suggests Hanesbrands might have to lower prices or invest in product improvements to accelerate growth, factors that can hinder near-term profitability. 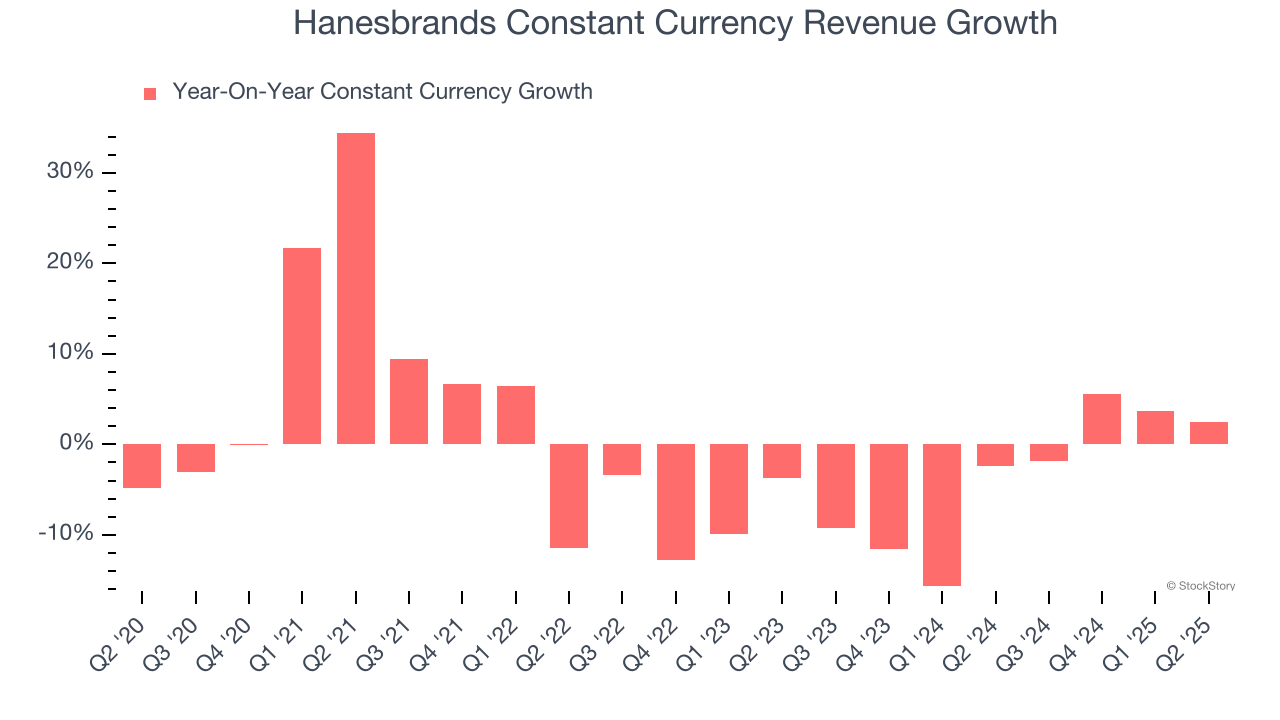
2. Projected Revenue Growth Shows Limited Upside
Forecasted revenues by Wall Street analysts signal a company’s potential. Predictions may not always be accurate, but accelerating growth typically boosts valuation multiples and stock prices while slowing growth does the opposite.
Over the next 12 months, sell-side analysts expect Hanesbrands’s revenue to stall. While this projection implies its newer products and services will catalyze better top-line performance, it is still below average for the sector.
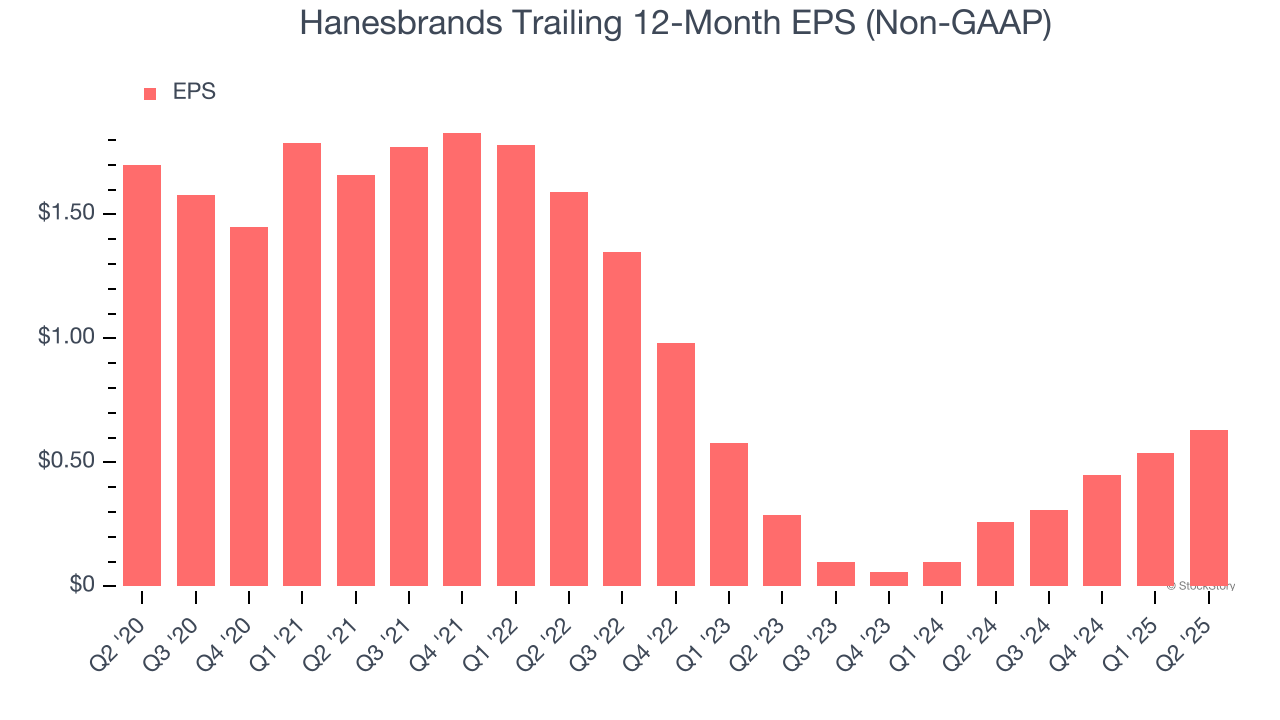
3. EPS Trending Down
We track the long-term change in earnings per share (EPS) because it highlights whether a company’s growth is profitable.
Sadly for Hanesbrands, its EPS declined by 18% annually over the last five years, more than its revenue. This tells us the company struggled because its fixed cost base made it difficult to adjust to shrinking demand.
Final Judgment
Hanesbrands doesn’t pass our quality test. Following the recent surge, the stock trades at 10.5× forward P/E (or $6.86 per share). While this valuation is fair, the upside isn’t great compared to the potential downside. There are more exciting stocks to buy at the moment. Let us point you toward a safe-and-steady industrials business benefiting from an upgrade cycle.
Stocks We Like More Than Hanesbrands
Donald Trump’s April 2025 "Liberation Day" tariffs sent markets into a tailspin, but stocks have since rebounded strongly, proving that knee-jerk reactions often create the best buying opportunities.
The smart money is already positioning for the next leg up. Don’t miss out on the recovery - check out our Top 5 Growth Stocks for this month. This is a curated list of our High Quality stocks that have generated a market-beating return of 183% over the last five years (as of March 31st 2025).
Stocks that made our list in 2020 include now familiar names such as Nvidia (+1,545% between March 2020 and March 2025) as well as under-the-radar businesses like the once-small-cap company Comfort Systems (+782% five-year return). Find your next big winner with StockStory today.
StockStory is growing and hiring equity analyst and marketing roles. Are you a 0 to 1 builder passionate about the markets and AI? See the open roles here.


