
Global payments technology company Visa (NYSE: V) announced better-than-expected revenue in Q3 CY2025, with sales up 11.5% year on year to $10.72 billion. Its non-GAAP profit of $2.98 per share was in line with analysts’ consensus estimates.
Is now the time to buy Visa? Find out by accessing our full research report, it’s free for active Edge members.
Visa (V) Q3 CY2025 Highlights:
- Volume Growth: 9% year-on-year growth vs analyst estimates of 8% (8.2% beat)
- Revenue: $10.72 billion vs analyst estimates of $10.61 billion (11.5% year-on-year growth, 1.1% beat)
- Pre-tax Profit: $6.22 billion (58% margin, 2.3% year-on-year decline)
- Adjusted EPS: $2.98 vs analyst estimates of $2.97 (in line)
- Market Capitalization: $670.1 billion
Company Overview
Processing over 829 million transactions daily and connecting billions of cards to 150 million merchant locations worldwide, Visa (NYSE: V) operates one of the world's largest electronic payments networks, facilitating secure money movement across more than 200 countries through its VisaNet processing platform.
Revenue Growth
A company’s long-term sales performance is one signal of its overall quality. Any business can put up a good quarter or two, but the best consistently grow over the long haul. Thankfully, Visa’s 12.9% annualized revenue growth over the last five years was solid. Its growth surpassed the average financials company and shows its offerings resonate with customers, a great starting point for our analysis.
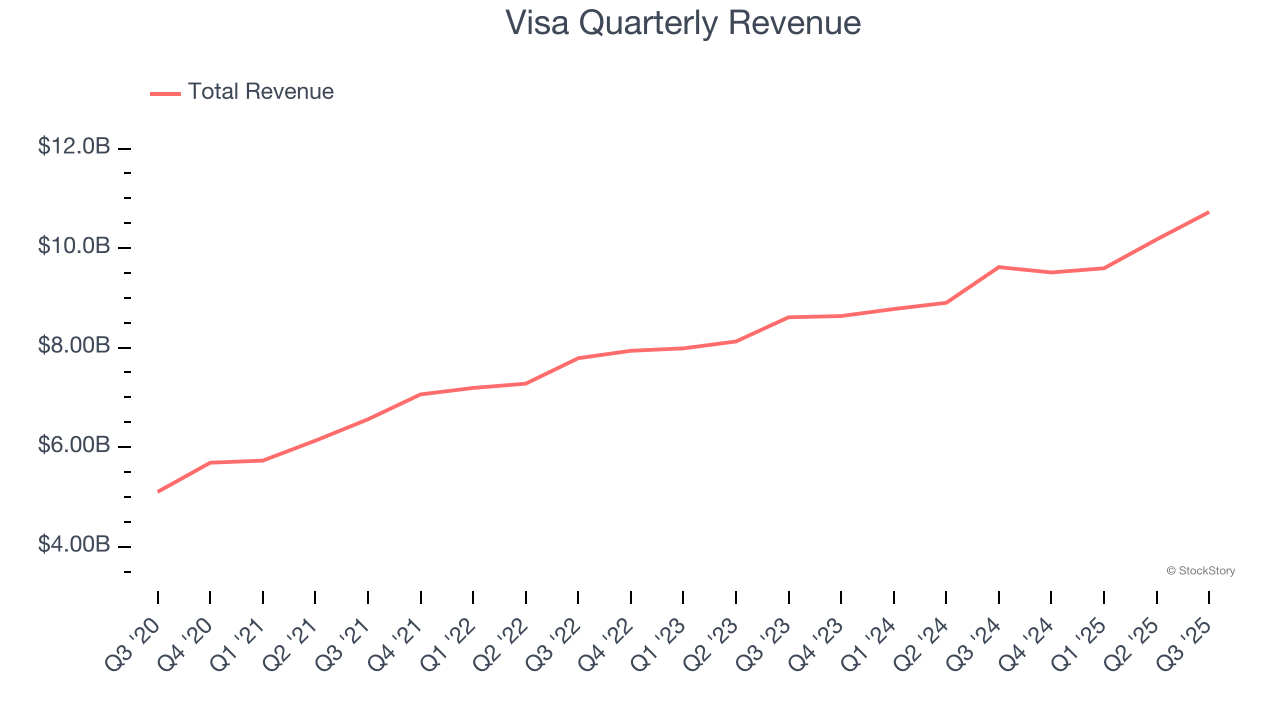
Long-term growth is the most important, but within financials, a half-decade historical view may miss recent interest rate changes and market returns. Visa’s annualized revenue growth of 10.7% over the last two years is below its five-year trend, but we still think the results were respectable. 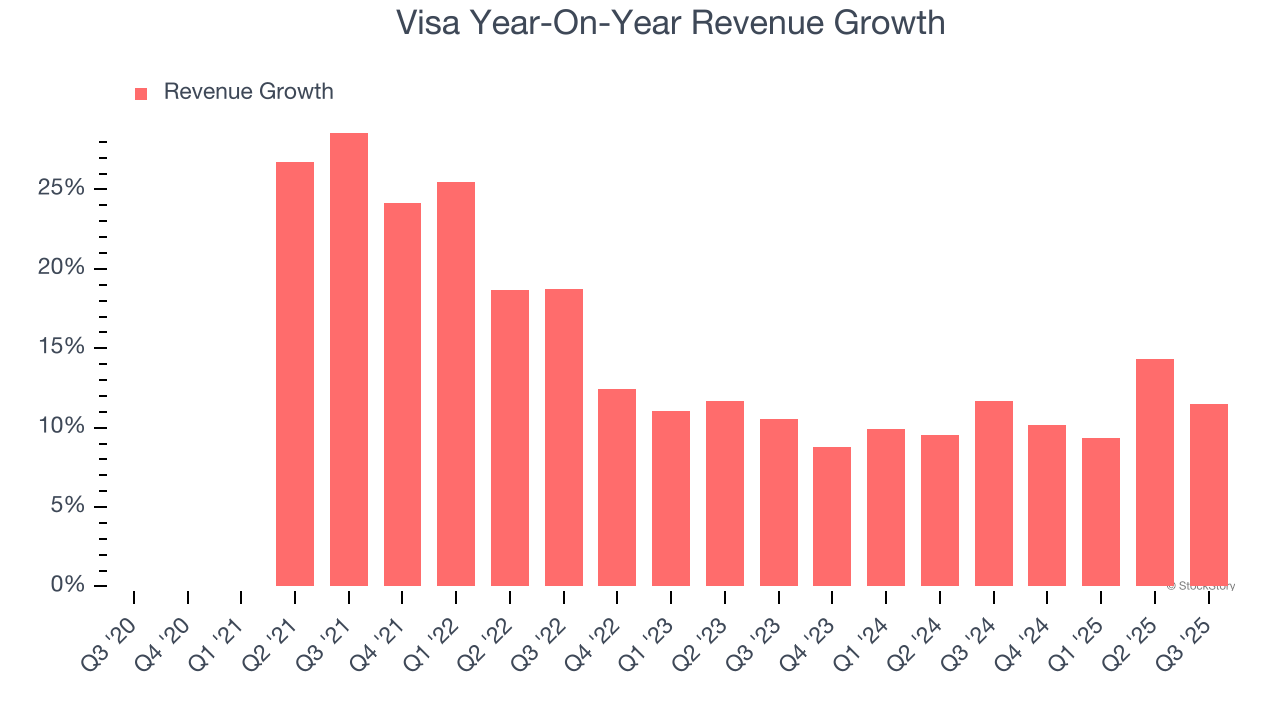 Note: Quarters not shown were determined to be outliers, impacted by outsized investment gains/losses that are not indicative of the recurring fundamentals of the business.
This quarter, Visa reported year-on-year revenue growth of 11.5%, and its $10.72 billion of revenue exceeded Wall Street’s estimates by 1.1%.
Unless you’ve been living under a rock, it should be obvious by now that generative AI is going to have a huge impact on how large corporations do business. While Nvidia and AMD are trading close to all-time highs, we prefer a lesser-known (but still profitable) stock benefiting from the rise of AI. Click here to access our free report one of our favorites growth stories.
Volume
The aggregate volume of transactions and loan originations processed by financial firms directly impacts their revenue and are fundamental to understanding their growth trajectories.
Visa’s volumes have grown at an annual rate of 39.5% over the last five years, much better than the broader financials industry and faster than its total revenue. When analyzing Visa’s volumes over the last two years, we can see that growth halted as volumes were flat. Its recent performance could limit any potential valuation multiple expansion.
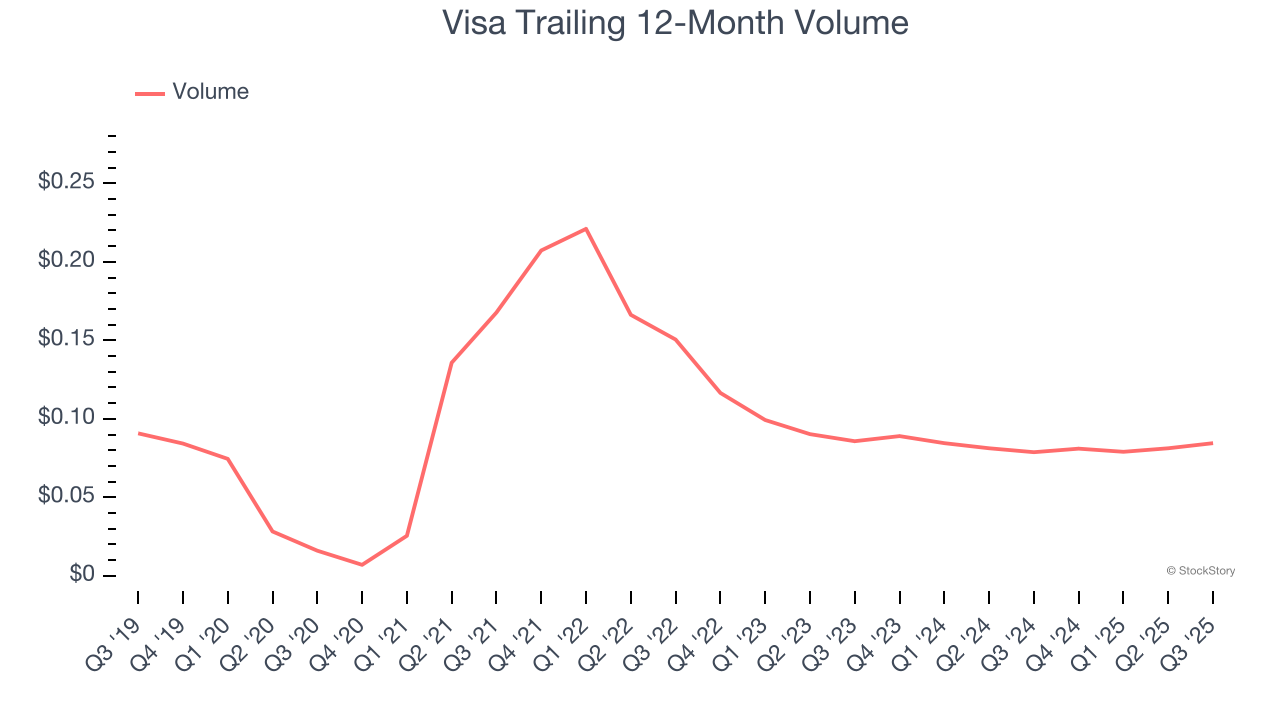
Visa’s volumes punched in at $0.09 this quarter, beating analysts’ expectations by 8.2%. This print was 16.9% higher than the same quarter last year.
Key Takeaways from Visa’s Q3 Results
We were impressed by how Visa blew past analysts’ transaction volume expectations this quarter, which drove its revenue beat. Zooming out, we think this was a decent quarter. The stock remained flat at $348.75 immediately after reporting.
Is Visa an attractive investment opportunity right now? The latest quarter does matter, but not nearly as much as longer-term fundamentals and valuation, when deciding if the stock is a buy. We cover that in our actionable full research report which you can read here, it’s free for active Edge members.