
Enterprise workflow automation company ServiceNow (NYSE: NOW) beat Wall Street’s revenue expectations in Q3 CY2025, with sales up 21.8% year on year to $3.41 billion. Its non-GAAP profit of $4.82 per share was 13% above analysts’ consensus estimates.
Is now the time to buy ServiceNow? Find out by accessing our full research report, it’s free for active Edge members.
ServiceNow (NOW) Q3 CY2025 Highlights:
- Revenue: $3.41 billion vs analyst estimates of $3.36 billion (21.8% year-on-year growth, 1.4% beat)
- Adjusted EPS: $4.82 vs analyst estimates of $4.27 (13% beat)
- Adjusted Operating Income: $1.14 billion vs analyst estimates of $1.03 billion (33.5% margin, 11.1% beat)
- Raised full-year subscription revenue guidance slightly (20% CC growth vs. 19.5-20% previously) and full-year operating margin as well (31% vs. 30.5% previously)
- Operating Margin: 16.8%, up from 14.9% in the same quarter last year
- Free Cash Flow Margin: 17.4%, up from 16.4% in the previous quarter
- Market Capitalization: $194.6 billion
“This outstanding Q3 performance is the clearest demonstration yet that ServiceNow is the AI platform for business transformation,” said ServiceNow Chairman and CEO Bill McDermott.
Company Overview
Built on a single code base that processes over 4 billion workflow transactions daily, ServiceNow (NYSE: NOW) provides a cloud-based platform that helps organizations automate and digitize workflows across departments, from IT and HR to customer service and security.
Revenue Growth
A company’s long-term sales performance can indicate its overall quality. Any business can put up a good quarter or two, but many enduring ones grow for years. Luckily, ServiceNow’s sales grew at a solid 24.6% compounded annual growth rate over the last five years. Its growth surpassed the average software company and shows its offerings resonate with customers, a great starting point for our analysis.
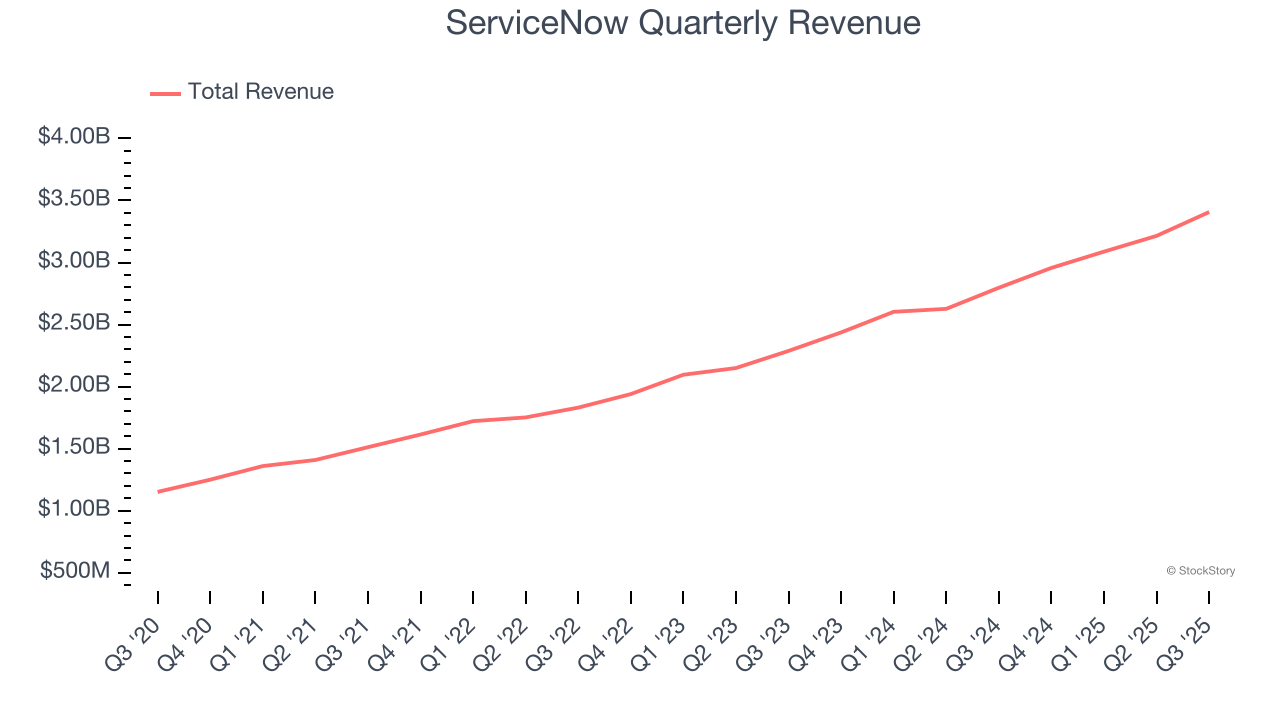
We at StockStory place the most emphasis on long-term growth, but within software, a half-decade historical view may miss recent innovations or disruptive industry trends. ServiceNow’s annualized revenue growth of 22.3% over the last two years is below its five-year trend, but we still think the results suggest healthy demand. 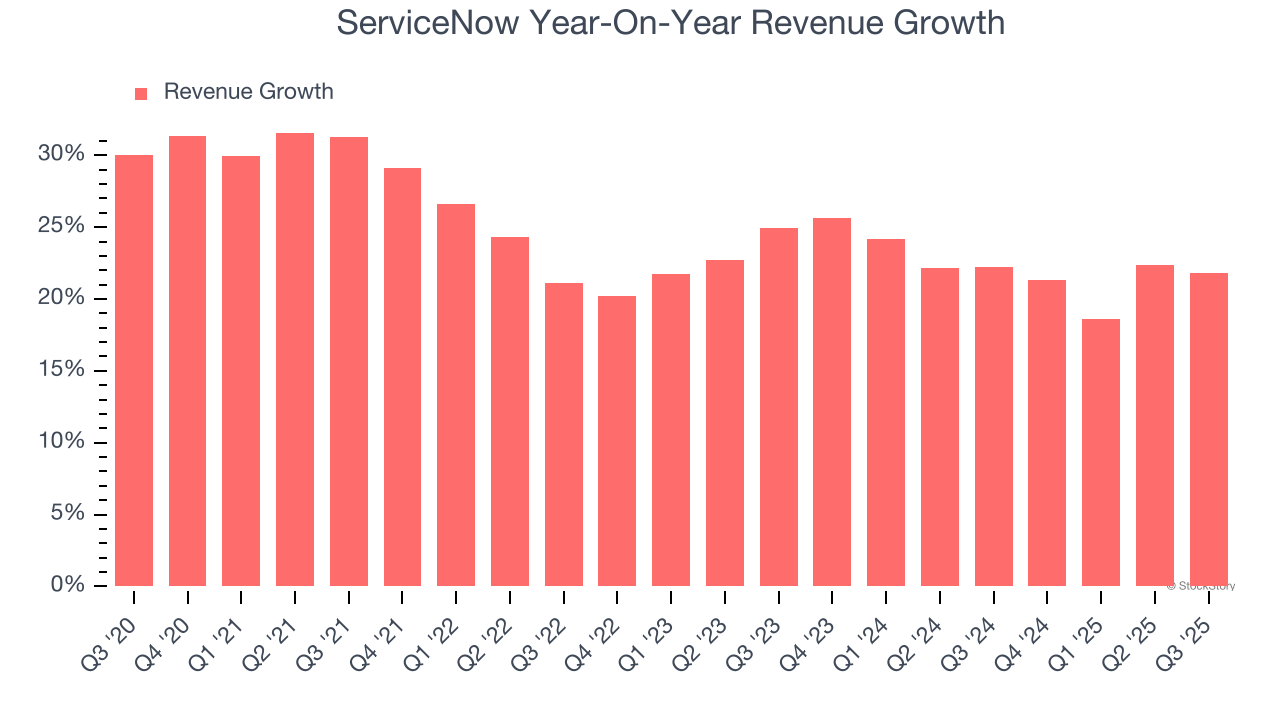
This quarter, ServiceNow reported robust year-on-year revenue growth of 21.8%, and its $3.41 billion of revenue topped Wall Street estimates by 1.4%.
Looking ahead, sell-side analysts expect revenue to grow 18% over the next 12 months, a deceleration versus the last two years. We still think its growth trajectory is attractive given its scale and implies the market is baking in success for its products and services.
Here at StockStory, we certainly understand the potential of thematic investing. Diverse winners from Microsoft (MSFT) to Alphabet (GOOG), Coca-Cola (KO) to Monster Beverage (MNST) could all have been identified as promising growth stories with a megatrend driving the growth. So, in that spirit, we’ve identified a relatively under-the-radar profitable growth stock benefiting from the rise of AI, available to you FREE via this link.
Customer Acquisition Efficiency
The customer acquisition cost (CAC) payback period represents the months required to recover the cost of acquiring a new customer. Essentially, it’s the break-even point for sales and marketing investments. A shorter CAC payback period is ideal, as it implies better returns on investment and business scalability.
ServiceNow is very efficient at acquiring new customers, and its CAC payback period checked in at 26.8 months this quarter. The company’s rapid recovery of its customer acquisition costs indicates it has a highly differentiated product offering and a strong brand reputation due to its scale. These dynamics give ServiceNow more resources to pursue new product initiatives while maintaining the flexibility to increase its sales and marketing investments. 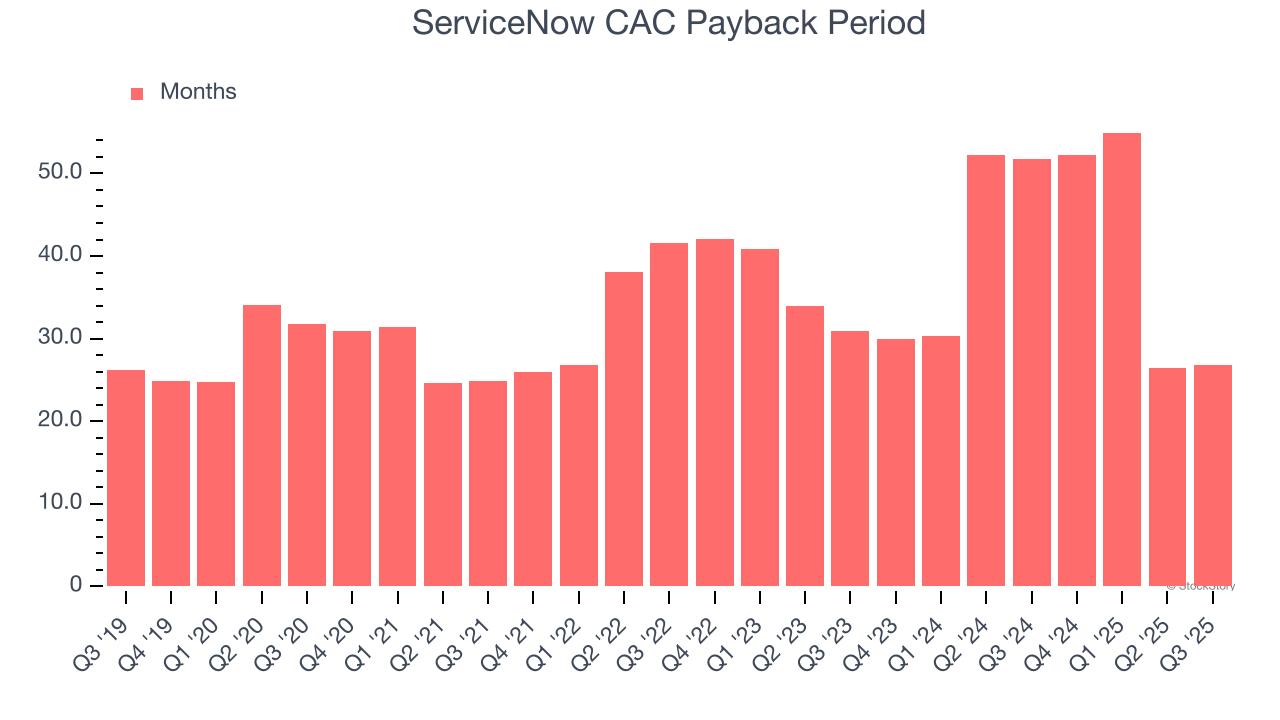
Key Takeaways from ServiceNow’s Q3 Results
This was a beat and raise quarter. Specifically, it was good to see ServiceNow top analysts’ revenue and adjusted operating profit expectations this quarter. Furthermore, it was good to see full-year guidance slightly raised for subscription revenue and operating margin. Overall, this print had plenty of positives. The stock traded up 4.6% to $955 immediately following the results.
So should you invest in ServiceNow right now? When making that decision, it’s important to consider its valuation, business qualities, as well as what has happened in the latest quarter. We cover that in our actionable full research report which you can read here, it’s free for active Edge members.