
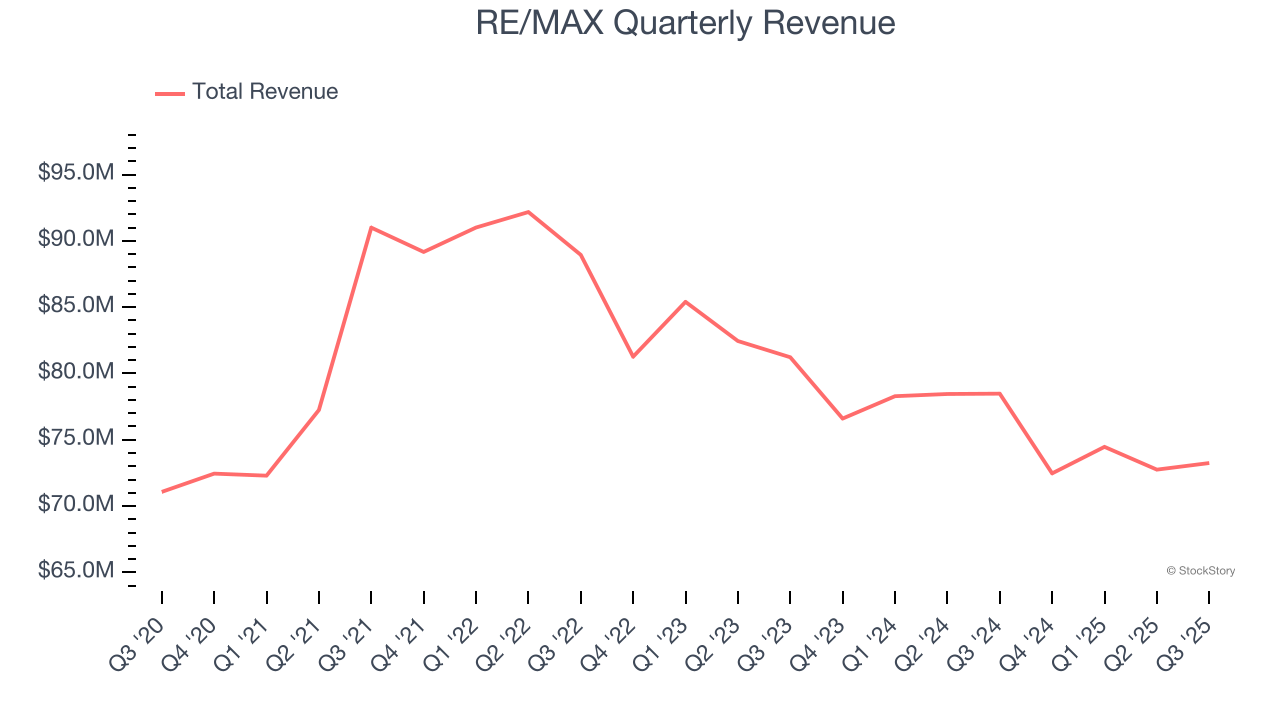
Real estate franchise company RE/MAX (NYSE: RMAX) fell short of the markets revenue expectations in Q3 CY2025, with sales falling 6.7% year on year to $73.25 million. On the other hand, the company expects next quarter’s revenue to be around $71.5 million, close to analysts’ estimates. Its non-GAAP profit of $0.37 per share was in line with analysts’ consensus estimates.
Is now the time to buy RE/MAX? Find out by accessing our full research report, it’s free for active Edge members.
RE/MAX (RMAX) Q3 CY2025 Highlights:
- Revenue: $73.25 million vs analyst estimates of $73.74 million (6.7% year-on-year decline, 0.7% miss)
- Adjusted EPS: $0.37 vs analyst estimates of $0.36 (in line)
- Adjusted EBITDA: $25.77 million vs analyst estimates of $25.68 million (35.2% margin, in line)
- Revenue Guidance for Q4 CY2025 is $71.5 million at the midpoint, roughly in line with what analysts were expecting
- Operating Margin: 25%, up from 19.4% in the same quarter last year
- Free Cash Flow Margin: 22.4%, up from 20.8% in the same quarter last year
- Agents: 147,547, up 2,064 year on year
- Market Capitalization: $166.2 million
"Our total REMAX agent count reached another all-time high this quarter, fueled by steady global growth and the strongest third-quarter U.S. agent count results we've had in three years. Based on feedback from the membership, we believe our mix of new ideas, new products and new systems is enhancing our value proposition and generating great energy within the network. At the same time, our constant focus on operational excellence is driving profitability and margin performance exceeding expectations," said Erik Carlson, Chief Executive Officer of RE/MAX Holdings.
Company Overview
Short for Real Estate Maximums, RE/MAX (NYSE: RMAX) operates a real estate franchise network spanning over 100 countries and territories.
Revenue Growth
A company’s long-term performance is an indicator of its overall quality. Any business can have short-term success, but a top-tier one grows for years. Unfortunately, RE/MAX’s 2.3% annualized revenue growth over the last five years was weak. This fell short of our benchmarks and is a poor baseline for our analysis.
We at StockStory place the most emphasis on long-term growth, but within consumer discretionary, a stretched historical view may miss a company riding a successful new product or trend. RE/MAX’s performance shows it grew in the past but relinquished its gains over the last two years, as its revenue fell by 5.8% annually. 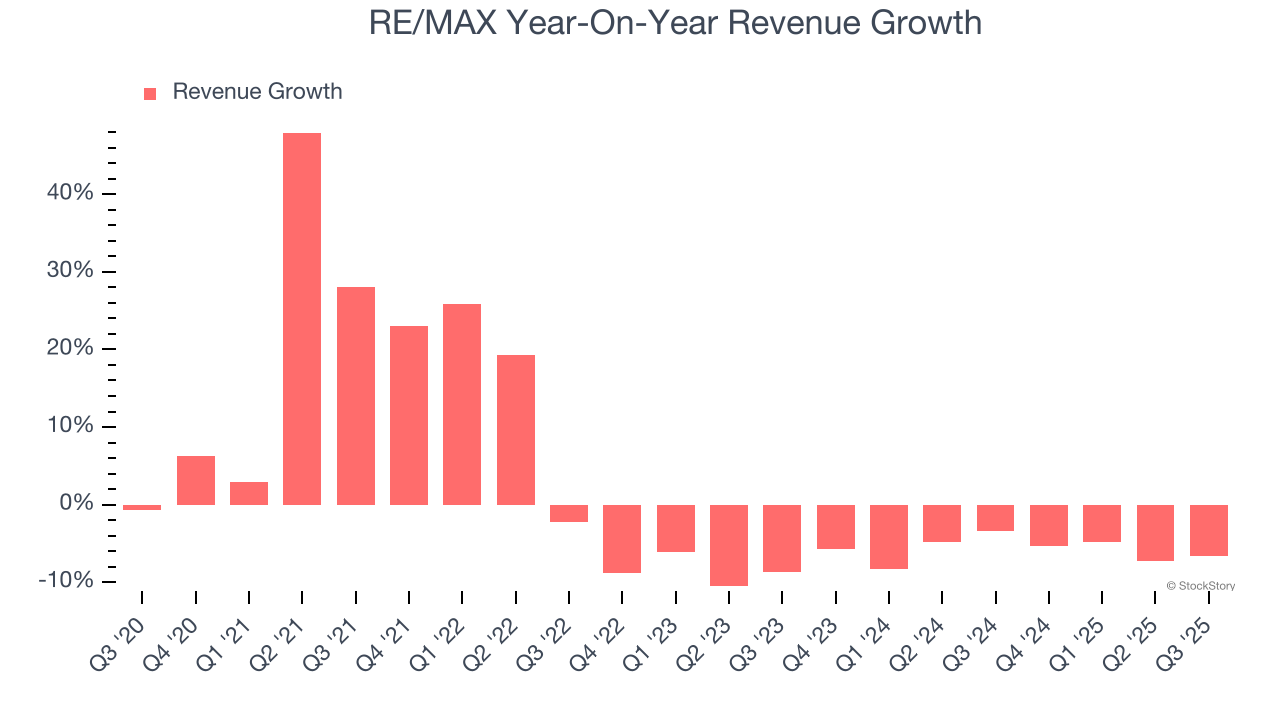
We can better understand the company’s revenue dynamics by analyzing its number of agents, which reached 147,547 in the latest quarter. Over the last two years, RE/MAX’s agents were flat. Because this number is higher than its revenue growth during the same period, we can see the company’s monetization has fallen. 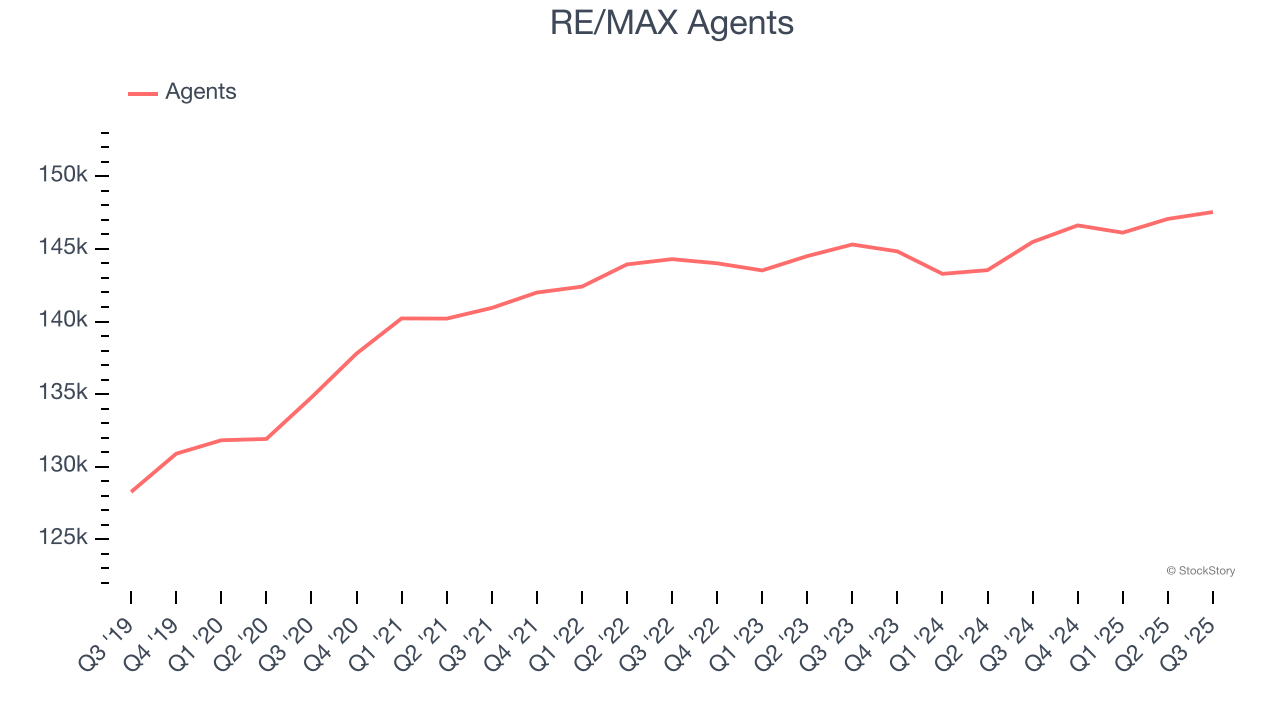
This quarter, RE/MAX missed Wall Street’s estimates and reported a rather uninspiring 6.7% year-on-year revenue decline, generating $73.25 million of revenue. Company management is currently guiding for a 1.3% year-on-year decline in sales next quarter.
Looking further ahead, sell-side analysts expect revenue to remain flat over the next 12 months. Although this projection implies its newer products and services will catalyze better top-line performance, it is still below the sector average.
Unless you’ve been living under a rock, it should be obvious by now that generative AI is going to have a huge impact on how large corporations do business. While Nvidia and AMD are trading close to all-time highs, we prefer a lesser-known (but still profitable) stock benefiting from the rise of AI. Click here to access our free report one of our favorites growth stories.
Operating Margin
Operating margin is a key measure of profitability. Think of it as net income - the bottom line - excluding the impact of taxes and interest on debt, which are less connected to business fundamentals.
RE/MAX’s operating margin has been trending up over the last 12 months and averaged 11.3% over the last two years. Its profitability was higher than the broader consumer discretionary sector, showing it did a decent job managing its expenses.
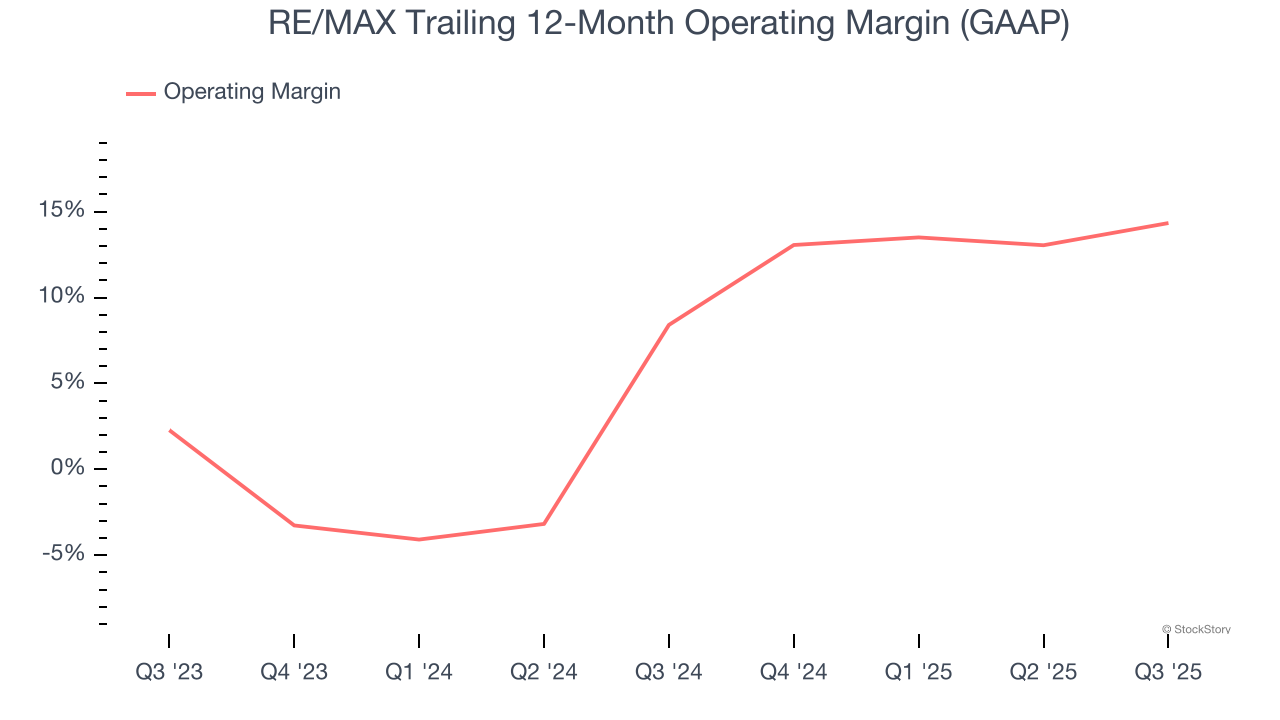
In Q3, RE/MAX generated an operating margin profit margin of 25%, up 5.6 percentage points year on year. This increase was a welcome development, especially since its revenue fell, showing it was more efficient because it scaled down its expenses.
Earnings Per Share
We track the long-term change in earnings per share (EPS) for the same reason as long-term revenue growth. Compared to revenue, however, EPS highlights whether a company’s growth is profitable.
Sadly for RE/MAX, its EPS declined by 7.1% annually over the last five years while its revenue grew by 2.3%. However, its operating margin actually improved during this time, telling us that non-fundamental factors such as interest expenses and taxes affected its ultimate earnings.
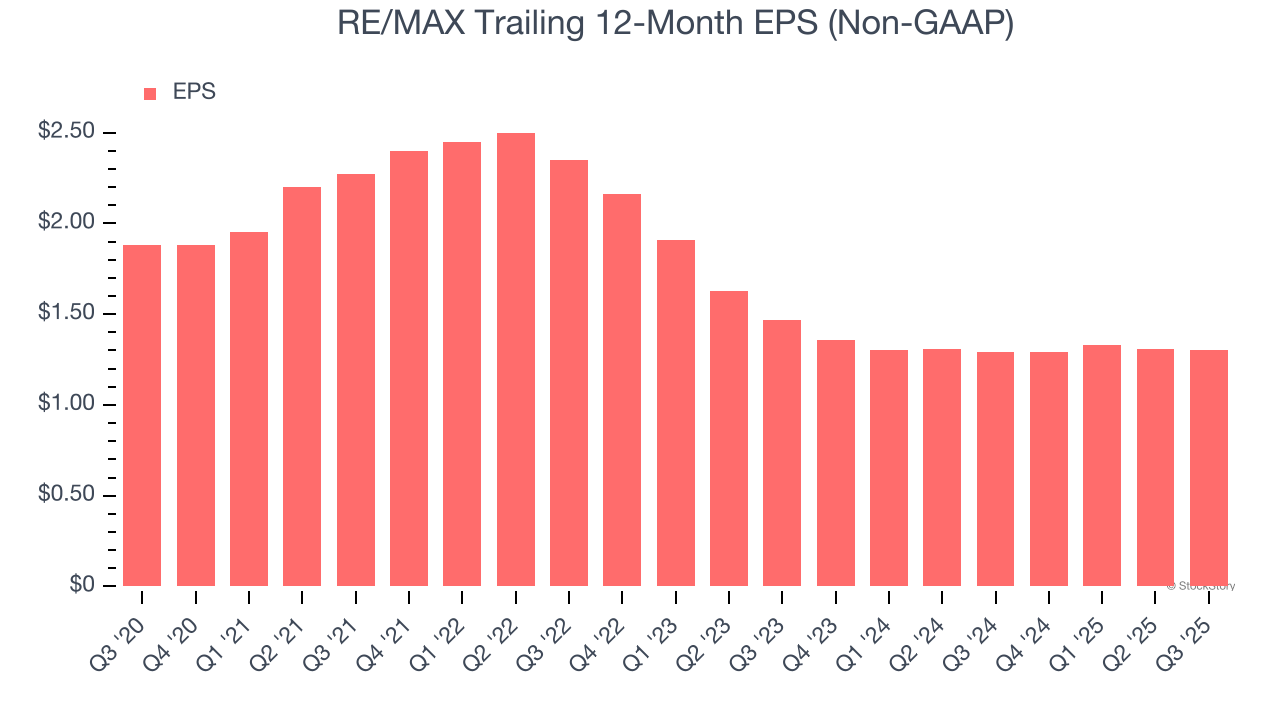
In Q3, RE/MAX reported adjusted EPS of $0.37, down from $0.38 in the same quarter last year. Despite falling year on year, this print beat analysts’ estimates by 1.6%. Over the next 12 months, Wall Street expects RE/MAX’s full-year EPS of $1.30 to shrink by 1.1%.
Key Takeaways from RE/MAX’s Q3 Results
This was a quarter without surprises. Revenue missed slightly, and EPS was in line. Looking ahead, EPS guidance for next quarter also met Wall Street's expectations. The stock remained flat at $8.27 immediately after reporting.
Big picture, is RE/MAX a buy here and now? If you’re making that decision, you should consider the bigger picture of valuation, business qualities, as well as the latest earnings. We cover that in our actionable full research report which you can read here, it’s free for active Edge members.


