
While the S&P 500 is up 32.7% since April 2025, Sallie Mae (currently trading at $27.55 per share) has lagged behind, posting a return of 10.5%. This was partly driven by its softer quarterly results and might have investors contemplating their next move.
Find out in our full research report, it’s free for active Edge members.
Why Does SLM Stock Spark Debate?
Originally created as a government-sponsored enterprise before privatizing in 2004, Sallie Mae (NASDAQ: SLM) is a financial services company that provides private education loans, savings products, and educational resources to help students and families pay for college.
Two Positive Attributes:
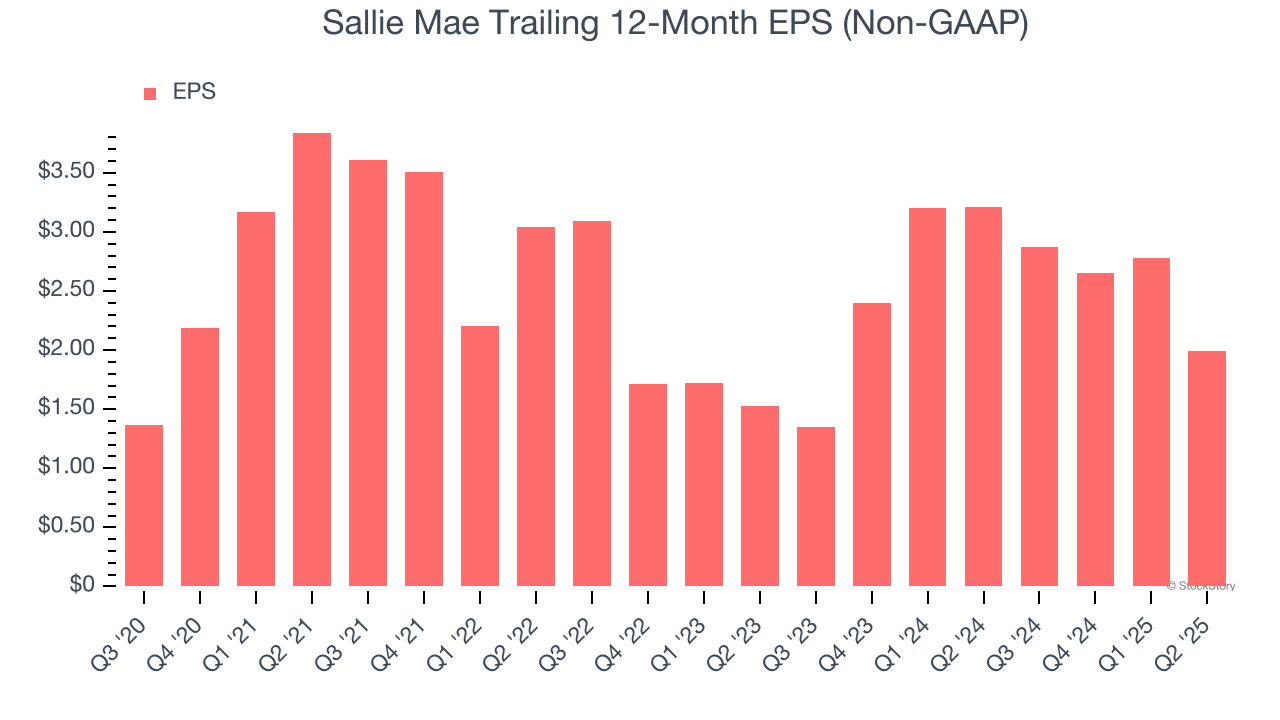
1. Outstanding Long-Term EPS Growth
We track the long-term change in earnings per share (EPS) because it highlights whether a company’s growth is profitable.
Sallie Mae’s EPS grew at a remarkable 19.8% compounded annual growth rate over the last five years, higher than its 1.6% annualized revenue declines. This tells us management adapted its cost structure in response to a challenging demand environment.
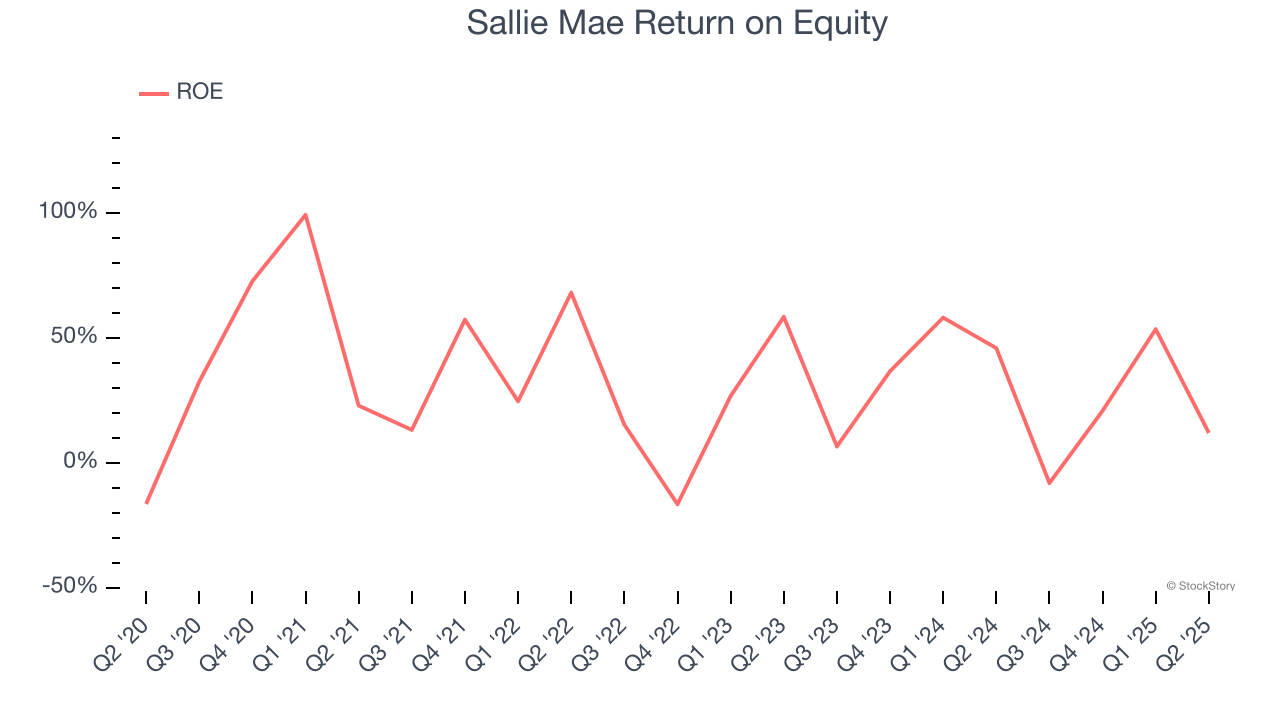
2. Stellar ROE Showcases Lucrative Growth Opportunities
Return on equity (ROE) reveals the profit generated per dollar of shareholder equity, which represents a key source of bank funding. Banks maintaining elevated ROE levels tend to accelerate wealth creation for shareholders via earnings retention, buybacks, and distributions.
Over the last five years, Sallie Mae has averaged an ROE of 34.9%, exceptional for a company operating in a sector where the average shakes out around 10% and those putting up 25%+ are greatly admired. This shows Sallie Mae has a strong competitive moat.
One Reason to be Careful:
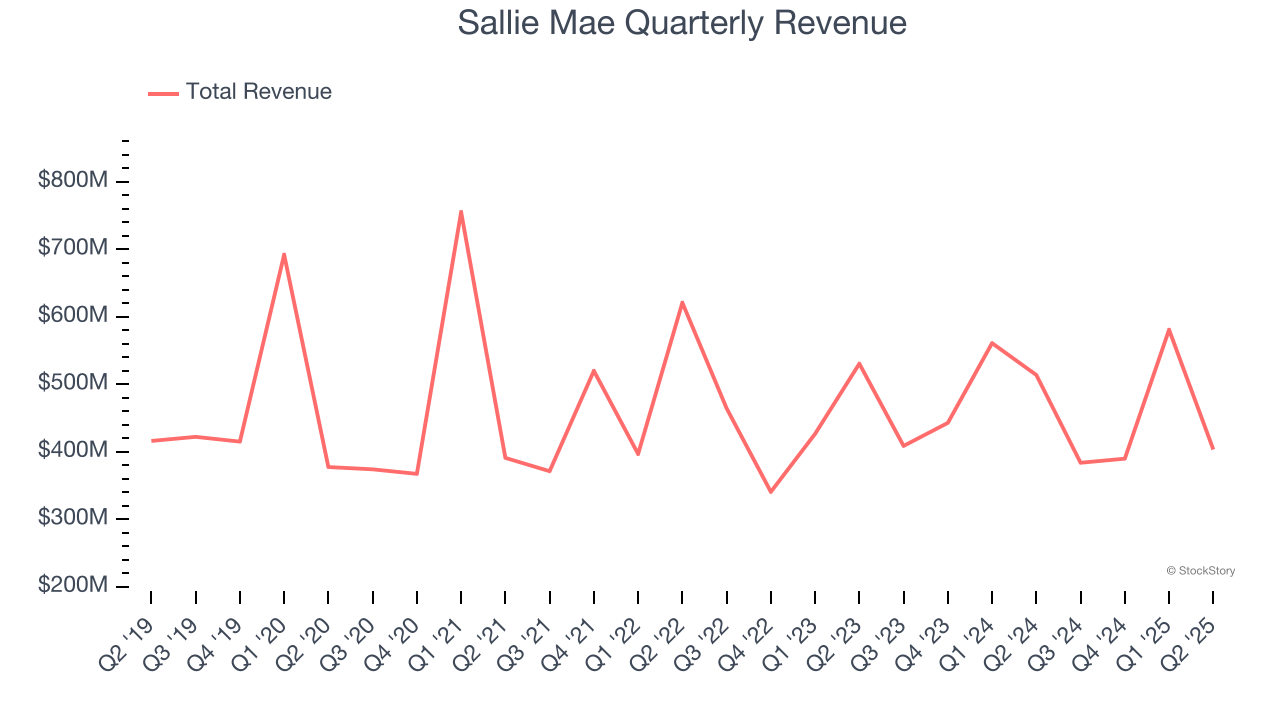
Revenue Spiraling Downwards
A company’s long-term sales performance can indicate its overall quality. Any business can put up a good quarter or two, but many enduring ones grow for years.
Over the last five years, Sallie Mae’s demand was weak and its revenue declined by 1.6% per year. This wasn’t a great result, but there are still things to like about Sallie Mae.
Final Judgment
Sallie Mae’s merits more than compensate for its flaws. With its shares lagging the market recently, the stock trades at 9.1× forward P/E (or $27.55 per share). Is now the time to initiate a position? See for yourself in our full research report, it’s free for active Edge members.
High-Quality Stocks for All Market Conditions
Donald Trump’s April 2025 "Liberation Day" tariffs sent markets into a tailspin, but stocks have since rebounded strongly, proving that knee-jerk reactions often create the best buying opportunities.
The smart money is already positioning for the next leg up. Don’t miss out on the recovery - check out our Top 5 Strong Momentum Stocks for this week. This is a curated list of our High Quality stocks that have generated a market-beating return of 183% over the last five years (as of March 31st 2025).
Stocks that made our list in 2020 include now familiar names such as Nvidia (+1,545% between March 2020 and March 2025) as well as under-the-radar businesses like the once-micro-cap company Tecnoglass (+1,754% five-year return). Find your next big winner with StockStory today.
StockStory is growing and hiring equity analyst and marketing roles. Are you a 0 to 1 builder passionate about the markets and AI? See the open roles here.