
Metal coating and infrastructure solutions provider AZZ (NYSE: AZZ) missed Wall Street’s revenue expectations in Q3 CY2025 as sales rose 2% year on year to $417.3 million. On the other hand, the company’s full-year revenue guidance of $1.68 billion at the midpoint came in 0.7% above analysts’ estimates. Its non-GAAP profit of $1.55 per share was 1.5% below analysts’ consensus estimates.
Is now the time to buy AZZ? Find out by accessing our full research report, it’s free for active Edge members.
AZZ (AZZ) Q3 CY2025 Highlights:
- Revenue: $417.3 million vs analyst estimates of $426.2 million (2% year-on-year growth, 2.1% miss)
- Adjusted EPS: $1.55 vs analyst expectations of $1.57 (1.5% miss)
- Adjusted EBITDA: $88.73 million vs analyst estimates of $95.01 million (21.3% margin, 6.6% miss)
- The company reconfirmed its revenue guidance for the full year of $1.68 billion at the midpoint
- Management reiterated its full-year Adjusted EPS guidance of $6 at the midpoint
- EBITDA guidance for the full year is $380 million at the midpoint, above analyst estimates of $373.7 million
- Operating Margin: 16.4%, in line with the same quarter last year
- Market Capitalization: $3.15 billion
Tom Ferguson, President, and Chief Executive Officer of AZZ, commented, "Second quarter sales expanded to $417.3 million, up 2.0% over the prior year, and generated adjusted diluted EPS of $1.55, up 13.1%. Metal Coatings delivered strong, double-digit sales gains on volume increases, while Precoat Metals' experienced weaker demand in several end markets. Infrastructure-driven project spending drove Metal Coatings second quarter results, supported by growth in construction, industrial, and electrical transmission and distribution end-markets. In line with broader industry trends, Precoat Metals' sales results were pressured by building construction, HVAC, and appliance end-markets. Adjusted EBITDA of $88.7 million or 21.3% of sales was down $3.1 million from the prior year same quarter, primarily attributable to the Welding Service's business within AVAIL and their normal slow summer season. On a year-to-date basis, sales increased $17.0 million, or 2.1% over prior year and Adjusted EBITDA increased $9.2 million, or 4.9% over prior year. We continue to have confidence that our full-year 2026 financial guidance is achievable, as we carefully monitor customer trends in key markets.
Company Overview
Responsible for projects like nuclear facilities, AZZ (NYSE: AZZ) is a provider of metal coating and power infrastructure solutions.
Revenue Growth
Examining a company’s long-term performance can provide clues about its quality. Any business can put up a good quarter or two, but the best consistently grow over the long haul. Over the last five years, AZZ grew its sales at an impressive 10.8% compounded annual growth rate. Its growth beat the average industrials company and shows its offerings resonate with customers, a helpful starting point for our analysis.
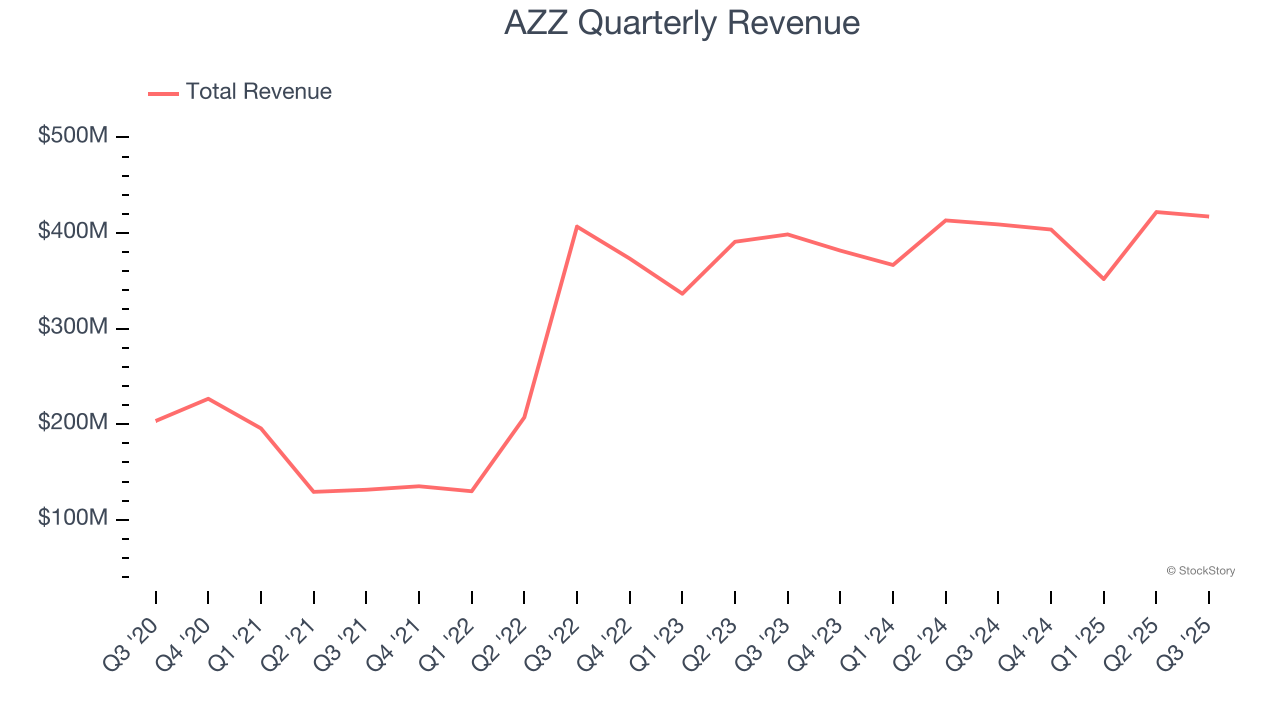
Long-term growth is the most important, but within industrials, a half-decade historical view may miss new industry trends or demand cycles. AZZ’s recent performance shows its demand has slowed significantly as its annualized revenue growth of 3.1% over the last two years was well below its five-year trend. 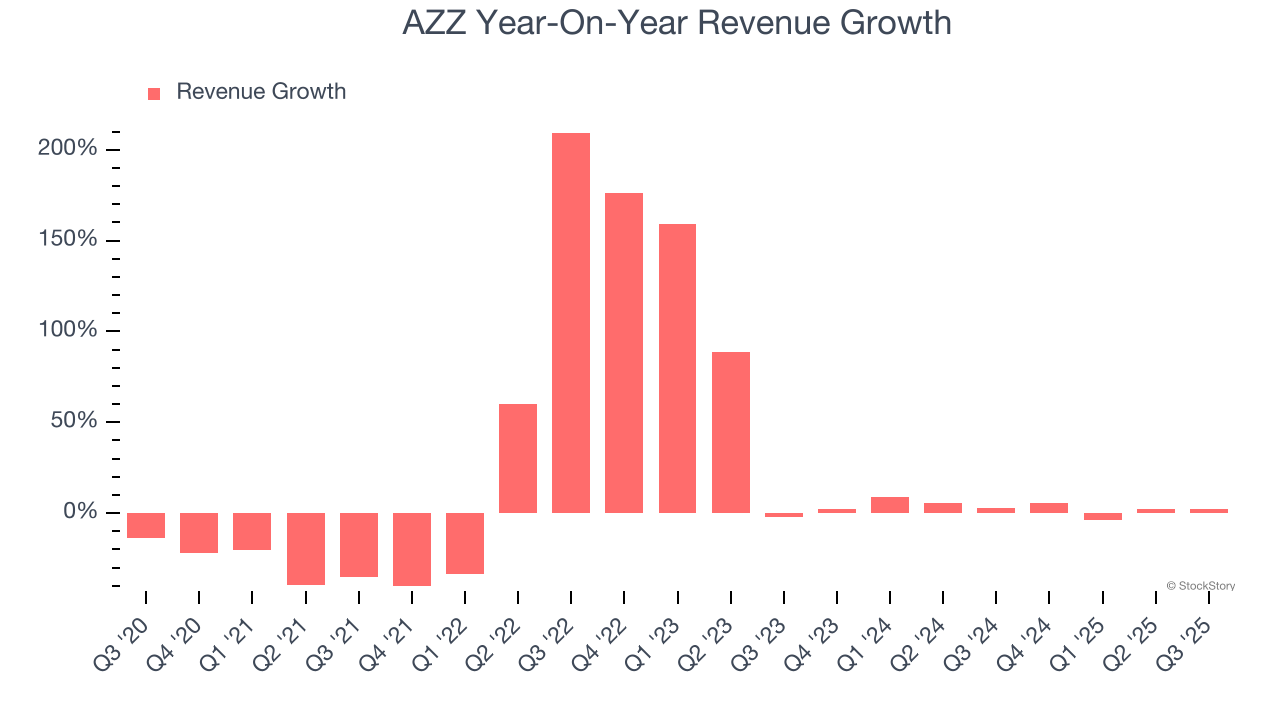
This quarter, AZZ’s revenue grew by 2% year on year to $417.3 million, falling short of Wall Street’s estimates.
Looking ahead, sell-side analysts expect revenue to grow 7% over the next 12 months. Although this projection suggests its newer products and services will spur better top-line performance, it is still below the sector average. At least the company is tracking well in other measures of financial health.
Software is eating the world and there is virtually no industry left that has been untouched by it. That drives increasing demand for tools helping software developers do their jobs, whether it be monitoring critical cloud infrastructure, integrating audio and video functionality, or ensuring smooth content streaming. Click here to access a free report on our 3 favorite stocks to play this generational megatrend.
Operating Margin
AZZ has been an efficient company over the last five years. It was one of the more profitable businesses in the industrials sector, boasting an average operating margin of 15%. This result was particularly impressive because of its low gross margin, which is mostly a factor of what it sells and takes huge shifts to move meaningfully. Companies have more control over their operating margins, and it’s a show of well-managed operations if they’re high when gross margins are low.
Analyzing the trend in its profitability, AZZ’s operating margin rose by 2.2 percentage points over the last five years, as its sales growth gave it operating leverage.
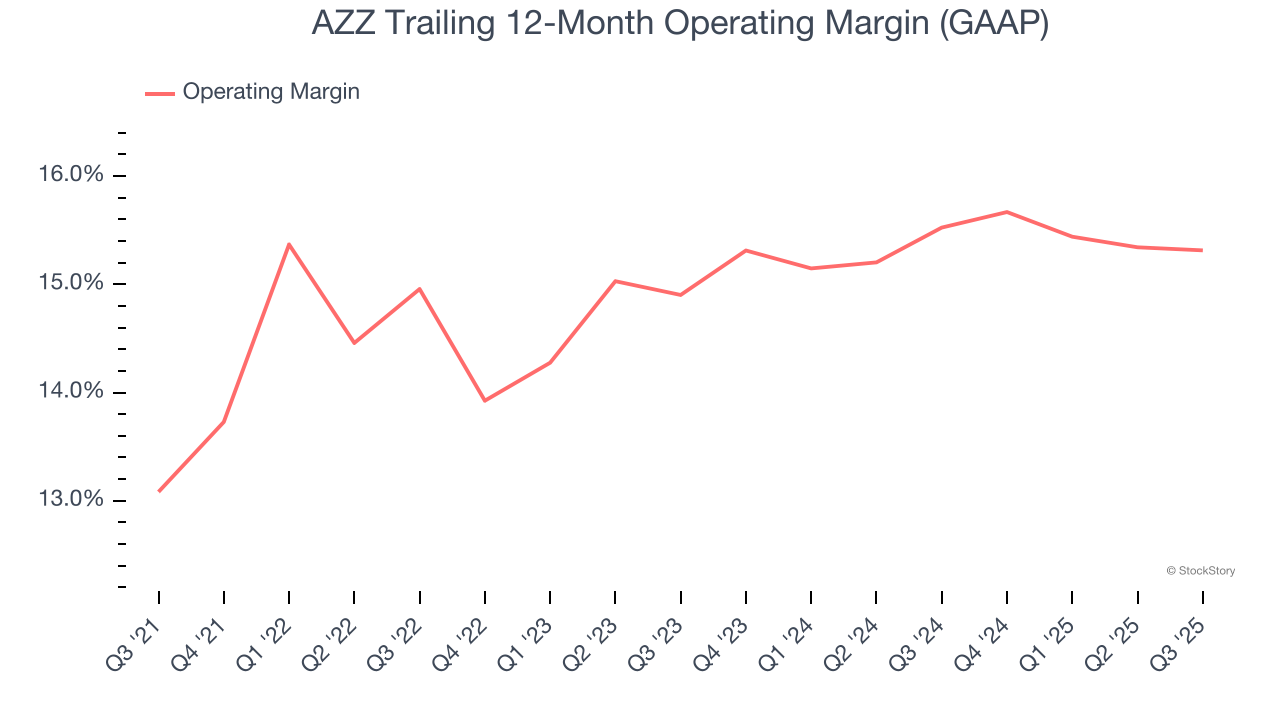
This quarter, AZZ generated an operating margin profit margin of 16.4%, in line with the same quarter last year. This indicates the company’s cost structure has recently been stable.
Earnings Per Share
We track the long-term change in earnings per share (EPS) for the same reason as long-term revenue growth. Compared to revenue, however, EPS highlights whether a company’s growth is profitable.
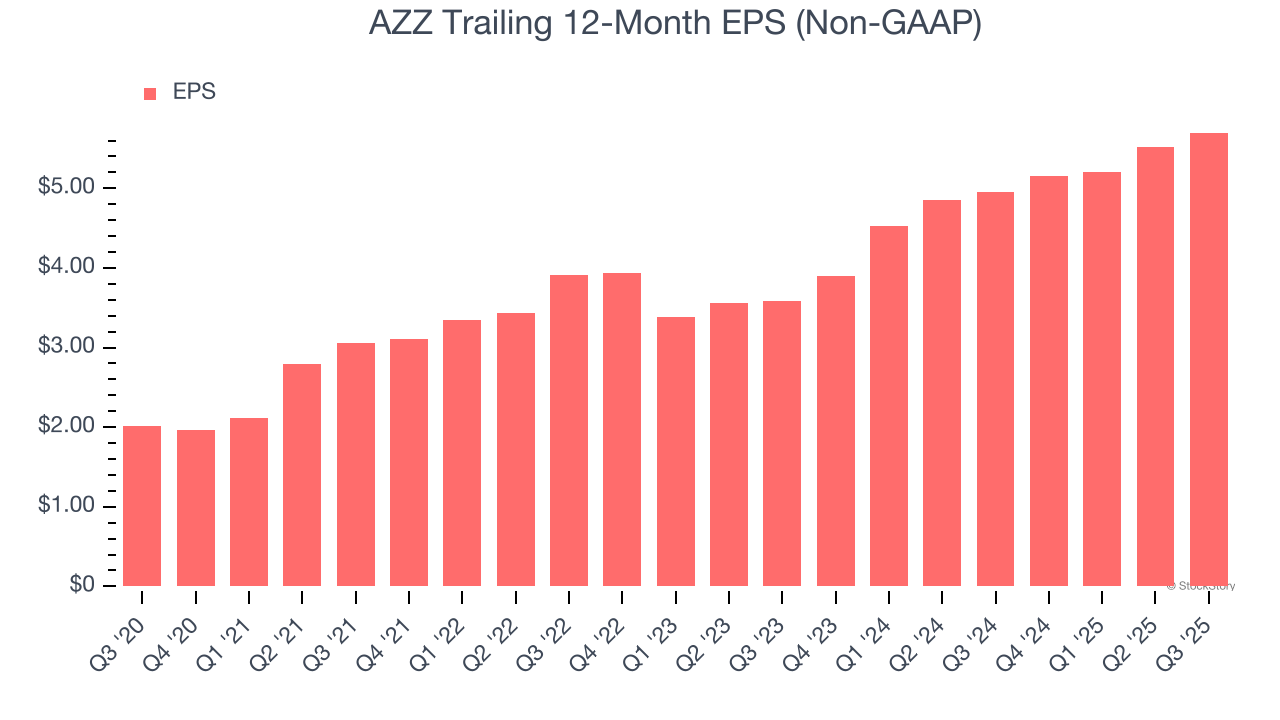
AZZ’s EPS grew at an astounding 23.2% compounded annual growth rate over the last five years, higher than its 10.8% annualized revenue growth. This tells us the company became more profitable on a per-share basis as it expanded.
We can take a deeper look into AZZ’s earnings to better understand the drivers of its performance. As we mentioned earlier, AZZ’s operating margin was flat this quarter but expanded by 2.2 percentage points over the last five years. This was the most relevant factor (aside from the revenue impact) behind its higher earnings; interest expenses and taxes can also affect EPS but don’t tell us as much about a company’s fundamentals.
Like with revenue, we analyze EPS over a shorter period to see if we are missing a change in the business.
For AZZ, its two-year annual EPS growth of 26% was higher than its five-year trend. We love it when earnings growth accelerates, especially when it accelerates off an already high base.
In Q3, AZZ reported adjusted EPS of $1.55, up from $1.37 in the same quarter last year. Despite growing year on year, this print slightly missed analysts’ estimates, but we care more about long-term adjusted EPS growth than short-term movements. Over the next 12 months, Wall Street expects AZZ’s full-year EPS of $5.70 to grow 10.7%.
Key Takeaways from AZZ’s Q3 Results
It was great to see AZZ’s full-year revenue and EBITDA guidance top analysts’ expectations. On the other hand, its revenue missed and its EBITDA fell short of Wall Street’s estimates. Overall, this was a weaker quarter. The stock traded down 4.9% to $100.76 immediately following the results.
AZZ didn’t show it’s best hand this quarter, but does that create an opportunity to buy the stock right now? What happened in the latest quarter matters, but not as much as longer-term business quality and valuation, when deciding whether to invest in this stock. We cover that in our actionable full research report which you can read here, it’s free for active Edge members.


