
Even though Capital One (currently trading at $220.50 per share) has gained 10.3% over the last six months, it has lagged the S&P 500’s 17.2% return during that period. This might have investors contemplating their next move.
Find out in our full research report, it’s free for active Edge members.
Why Does COF Stock Spark Debate?
Starting as a credit card company in 1988 before expanding into a full-service bank, Capital One (NYSE: COF) is a financial services company that offers credit cards, auto loans, banking services, and commercial lending to consumers and businesses.
Two Positive Attributes:
1. Long-Term Revenue Growth Shows Momentum
A company’s long-term sales performance is one signal of its overall quality. Even a bad business can shine for one or two quarters, but a top-tier one grows for years.
Over the last five years, Capital One grew its revenue at a decent 10.9% compounded annual growth rate. Its growth was slightly above the average financials company and shows its offerings resonate with customers.

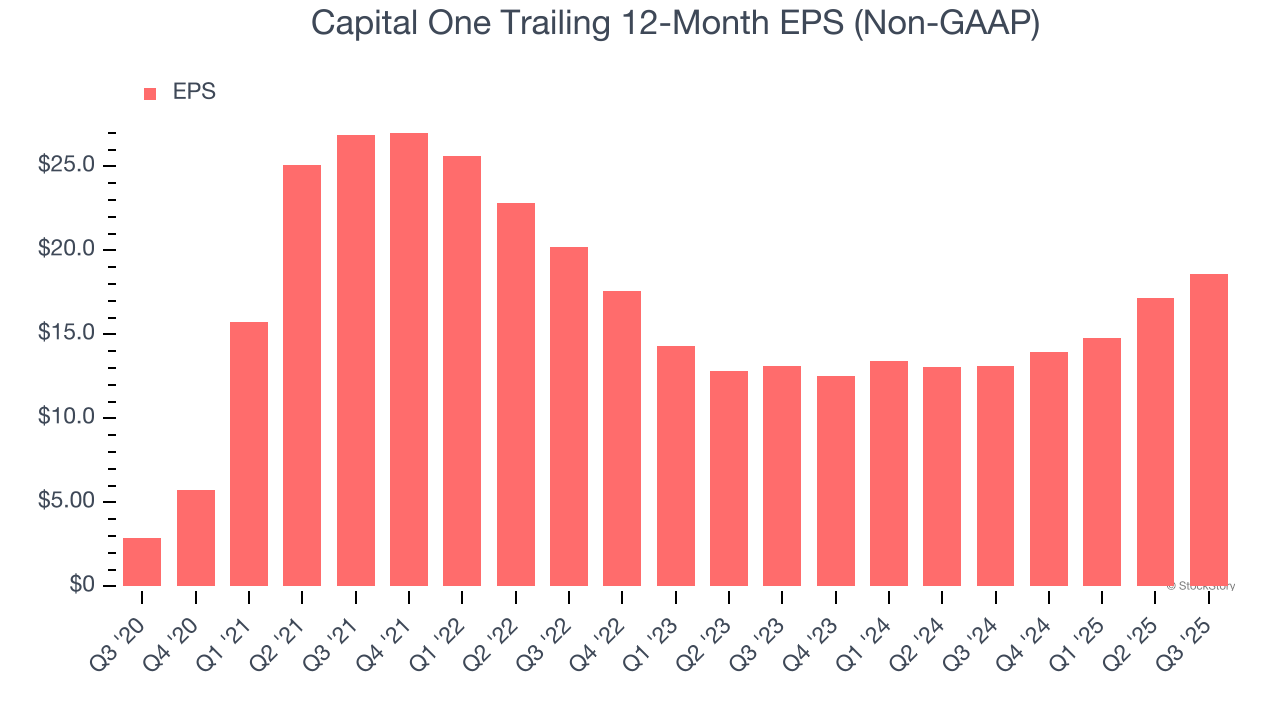
2. Outstanding Long-Term EPS Growth
We track the long-term change in earnings per share (EPS) because it highlights whether a company’s growth is profitable.
Capital One’s EPS grew at an astounding 44.9% compounded annual growth rate over the last five years, higher than its 10.9% annualized revenue growth. This tells us the company became more profitable on a per-share basis as it expanded.
One Reason to be Careful:
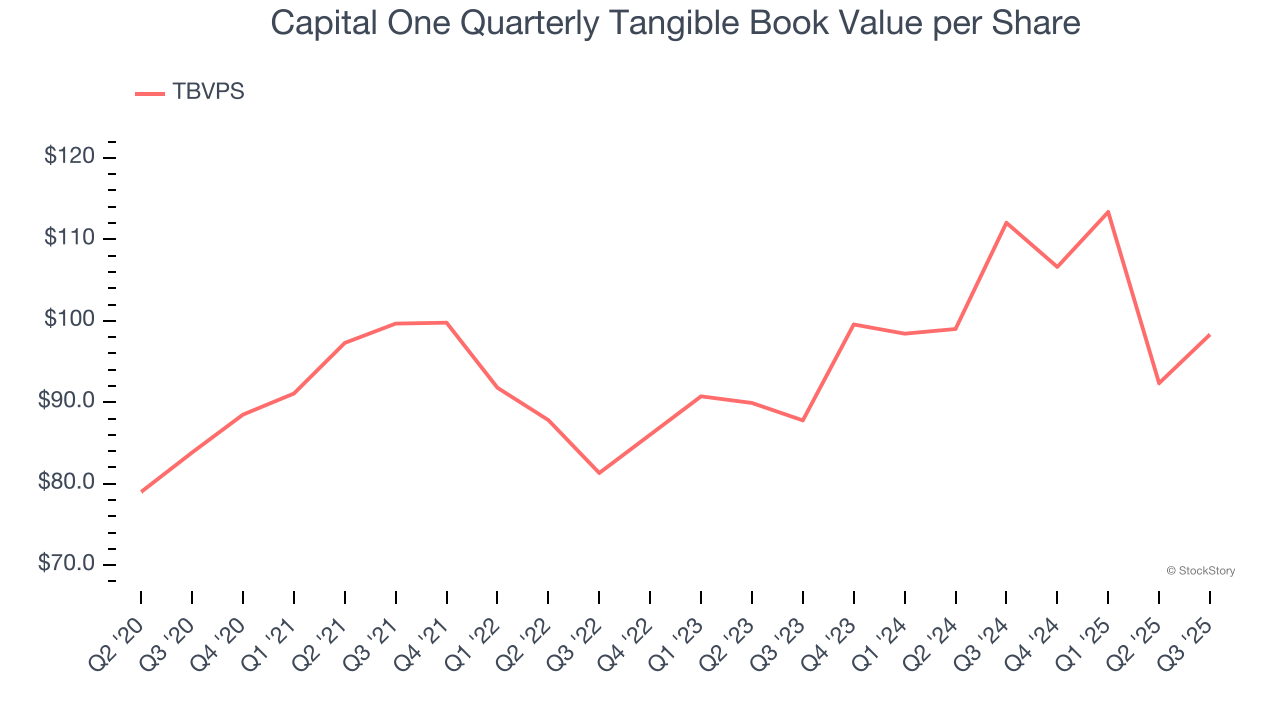
Substandard TBVPS Growth Indicates Limited Asset Expansion
Tangible book value per share (TBVPS) serves as a key indicator of a financial institution’s strength, representing the hard assets available to shareholders after removing intangible assets that could evaporate during economic distress.
To the detriment of investors, Capital One’s TBVPS grew at a tepid 5.8% annual clip over the last two years.
Final Judgment
Capital One has huge potential even though it has some open questions. With its shares trailing the market in recent months, the stock trades at 11.1× forward P/E (or $220.50 per share). Is now the right time to buy? See for yourself in our in-depth research report, it’s free for active Edge members.
High-Quality Stocks for All Market Conditions
Donald Trump’s April 2025 "Liberation Day" tariffs sent markets into a tailspin, but stocks have since rebounded strongly, proving that knee-jerk reactions often create the best buying opportunities.
The smart money is already positioning for the next leg up. Don’t miss out on the recovery - check out our Top 5 Growth Stocks for this month. This is a curated list of our High Quality stocks that have generated a market-beating return of 183% over the last five years (as of March 31st 2025).
Stocks that made our list in 2020 include now familiar names such as Nvidia (+1,545% between March 2020 and March 2025) as well as under-the-radar businesses like the once-micro-cap company Kadant (+351% five-year return). Find your next big winner with StockStory today.
StockStory is growing and hiring equity analyst and marketing roles. Are you a 0 to 1 builder passionate about the markets and AI? See the open roles here.


