Semiconductor machinery manufacturer Applied Materials (NASDAQ: AMAT) reported revenue ahead of Wall Streets expectations in Q3 CY2025, but sales fell by 3.5% year on year to $6.8 billion. Guidance for next quarter’s revenue was better than expected at $6.85 billion at the midpoint, 0.7% above analysts’ estimates. Its non-GAAP profit of $2.17 per share was 3.3% above analysts’ consensus estimates.
Is now the time to buy Applied Materials? Find out by accessing our full research report, it’s free for active Edge members.
Applied Materials (AMAT) Q3 CY2025 Highlights:
- Revenue: $6.8 billion vs analyst estimates of $6.65 billion (3.5% year-on-year decline, 2.2% beat)
- Adjusted EPS: $2.17 vs analyst estimates of $2.10 (3.3% beat)
- Adjusted Operating Income: $1.95 billion vs analyst estimates of $1.89 billion (28.6% margin, 2.9% beat)
- Revenue Guidance for Q4 CY2025 is $6.85 billion at the midpoint, roughly in line with what analysts were expecting
- Adjusted EPS guidance for Q4 CY2025 is $2.18 at the midpoint, above analyst estimates of $2.15
- Operating Margin: 25.2%, down from 29% in the same quarter last year
- Free Cash Flow Margin: 30%, similar to the same quarter last year
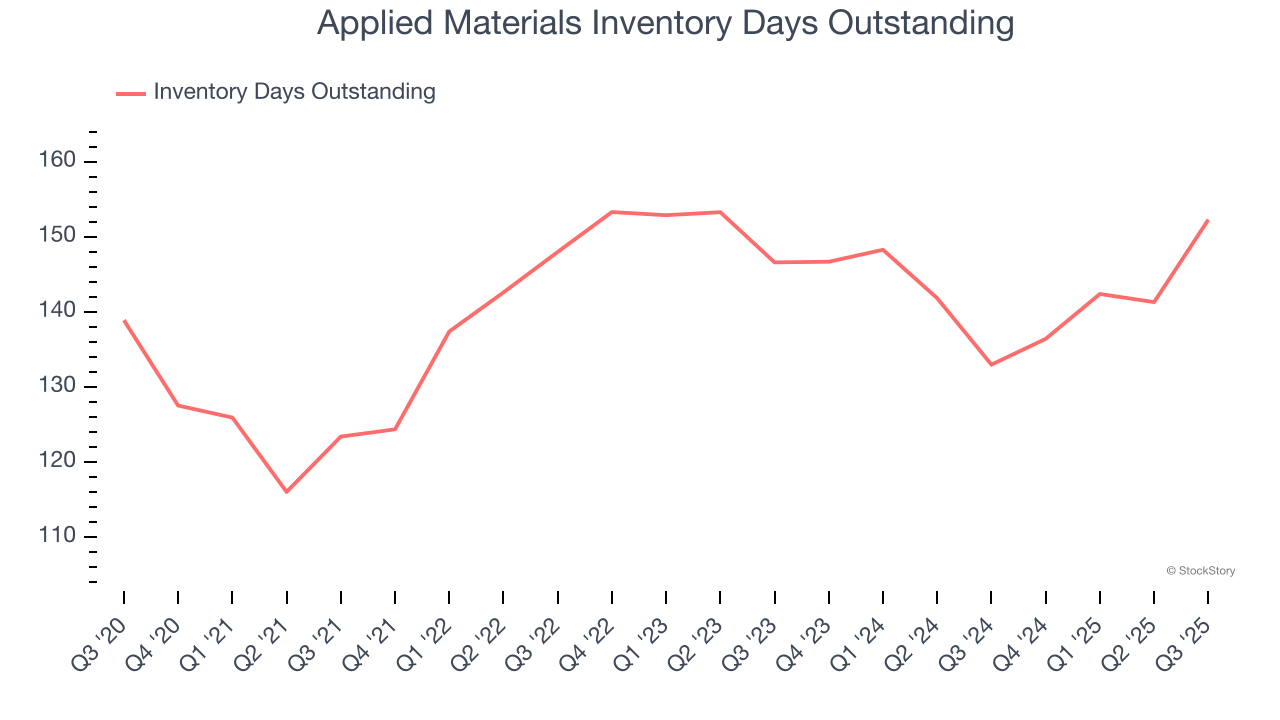
- Inventory Days Outstanding: 152, up from 141 in the previous quarter
- Market Capitalization: $183.8 billion
“As AI adoption drives substantial investment in advanced semiconductors and wafer fab equipment, Applied Materials delivered its sixth consecutive year of growth in fiscal 2025,” said Gary Dickerson, President and CEO.
Company Overview
Founded in 1967 as the first company to develop tools for other businesses in the semiconductor industry, Applied Materials (NASDAQ: AMAT) is the largest provider of semiconductor wafer fabrication equipment.
Revenue Growth
Examining a company’s long-term performance can provide clues about its quality. Any business can put up a good quarter or two, but the best consistently grow over the long haul. Luckily, Applied Materials’s sales grew at a solid 10.5% compounded annual growth rate over the last five years. Its growth beat the average semiconductor company and shows its offerings resonate with customers. Semiconductors are a cyclical industry, and long-term investors should be prepared for periods of high growth followed by periods of revenue contractions.
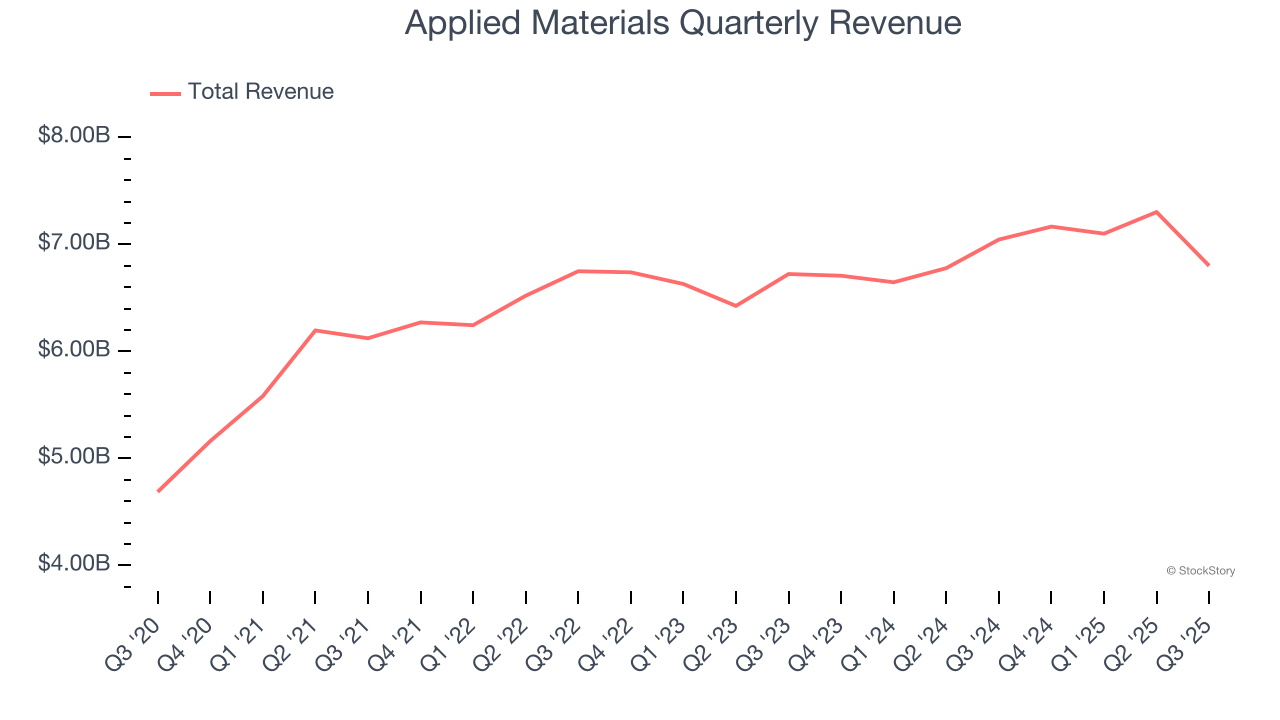
Long-term growth is the most important, but short-term results matter for semiconductors because the rapid pace of technological innovation (Moore's Law) could make yesterday's hit product obsolete today. Applied Materials’s annualized revenue growth of 3.4% over the last two years is below its five-year trend, but we still think the results were respectable. 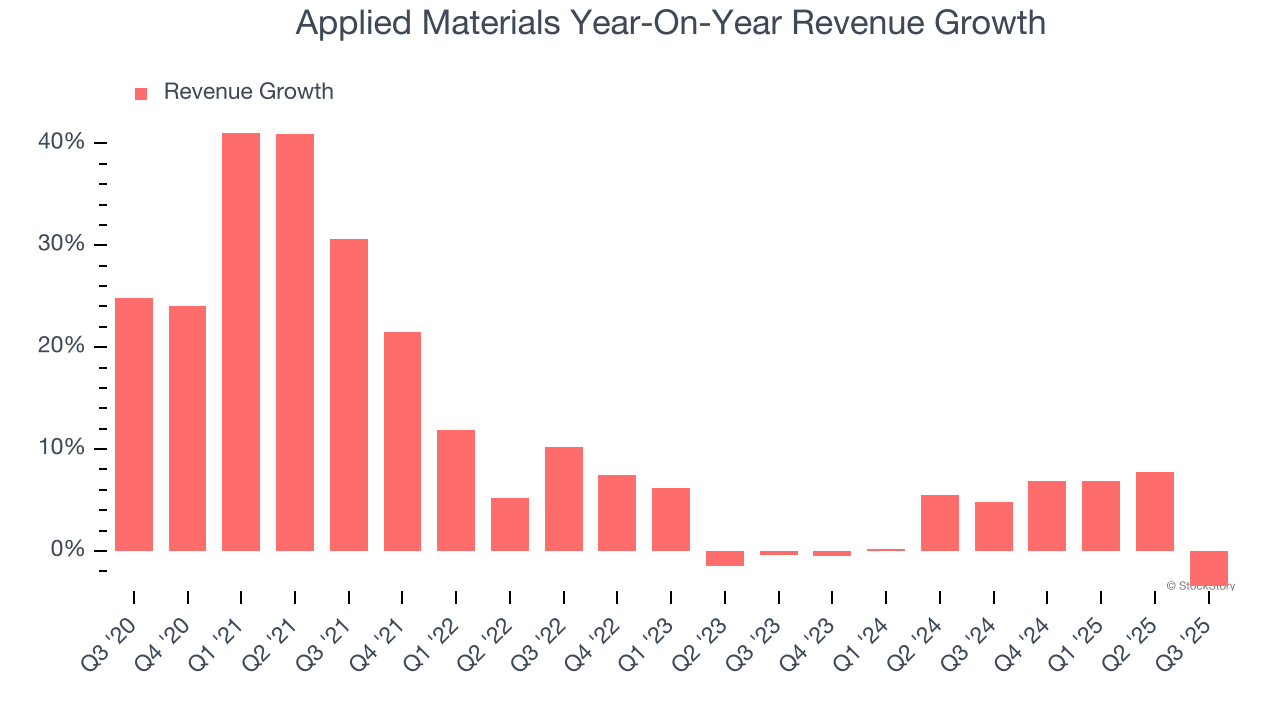
This quarter, Applied Materials’s revenue fell by 3.5% year on year to $6.8 billion but beat Wall Street’s estimates by 2.2%. Company management is currently guiding for a 4.4% year-on-year decline in sales next quarter.
Looking further ahead, sell-side analysts expect revenue to grow 1.7% over the next 12 months, a slight deceleration versus the last two years. This projection doesn't excite us and suggests its products and services will see some demand headwinds.
Microsoft, Alphabet, Coca-Cola, Monster Beverage—all began as under-the-radar growth stories riding a massive trend. We’ve identified the next one: a profitable AI semiconductor play Wall Street is still overlooking. Go here for access to our full report.
Product Demand & Outstanding Inventory
Days Inventory Outstanding (DIO) is an important metric for chipmakers, as it reflects a business’ capital intensity and the cyclical nature of semiconductor supply and demand. In a tight supply environment, inventories tend to be stable, allowing chipmakers to exert pricing power. Steadily increasing DIO can be a warning sign that demand is weak, and if inventories continue to rise, the company may have to downsize production.
This quarter, Applied Materials’s DIO came in at 152, which is 13 days above its five-year average, suggesting that the company’s inventory has grown to higher levels than we’ve seen in the past.
Key Takeaways from Applied Materials’s Q3 Results
It was good to see Applied Materials beat analysts’ EPS expectations this quarter. We were also happy its adjusted operating income outperformed Wall Street’s estimates. On the other hand, its inventory levels materially increased. Overall, this print had some key positives. The market seemed to be hoping for more, and the stock traded down 2.1% to $219.15 immediately following the results.
So do we think Applied Materials is an attractive buy at the current price? The latest quarter does matter, but not nearly as much as longer-term fundamentals and valuation, when deciding if the stock is a buy. We cover that in our actionable full research report which you can read here, it’s free for active Edge members.