Even though Warner Music Group (currently trading at $30.43 per share) has gained 10.7% over the last six months, it has lagged the S&P 500’s 16.4% return during that period. This may have investors wondering how to approach the situation.
Is now the time to buy Warner Music Group, or should you be careful about including it in your portfolio? Dive into our full research report to see our analyst team’s opinion, it’s free for active Edge members.
Why Is Warner Music Group Not Exciting?
We don't have much confidence in Warner Music Group. Here are three reasons there are better opportunities than WMG and a stock we'd rather own.
1. Long-Term Revenue Growth Disappoints
Examining a company’s long-term performance can provide clues about its quality. Any business can put up a good quarter or two, but many enduring ones grow for years. Over the last five years, Warner Music Group grew its sales at a sluggish 7.7% compounded annual growth rate. This fell short of our benchmark for the consumer discretionary sector.
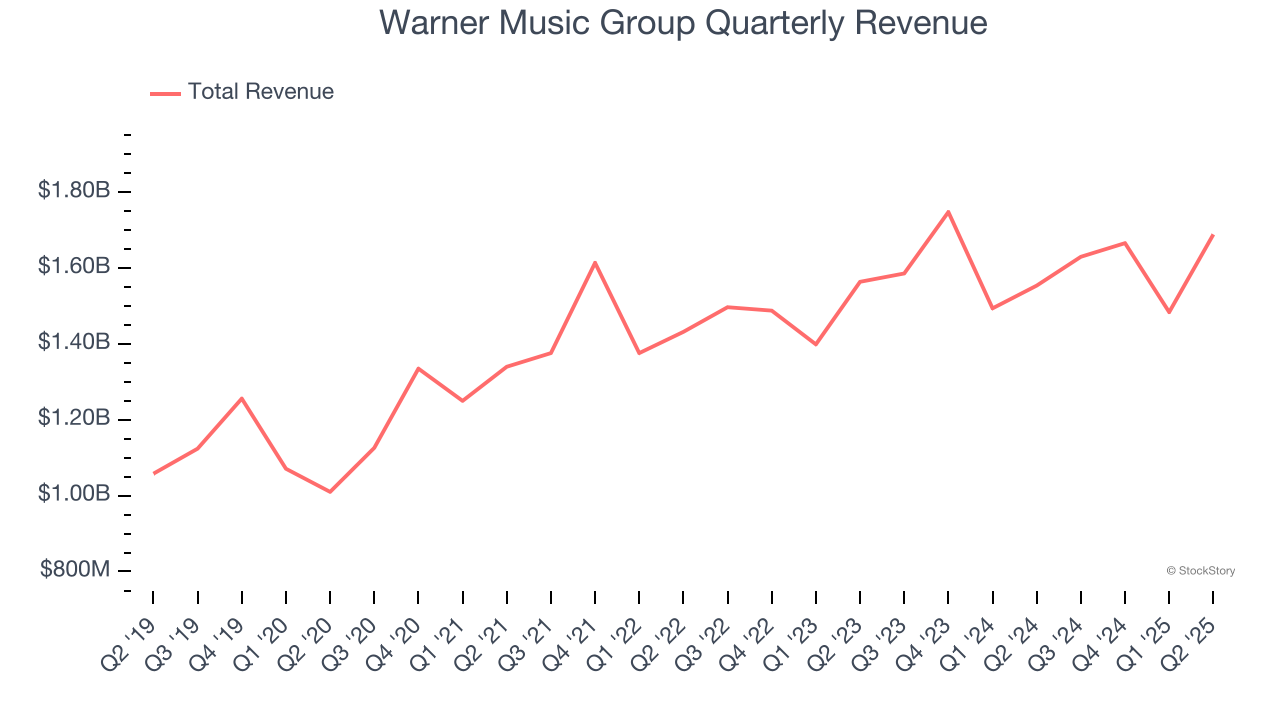
2. Projected Revenue Growth Is Slim
Forecasted revenues by Wall Street analysts signal a company’s potential. Predictions may not always be accurate, but accelerating growth typically boosts valuation multiples and stock prices while slowing growth does the opposite.
Over the next 12 months, sell-side analysts expect Warner Music Group’s revenue to rise by 5%, close to its 7.7% annualized growth for the past five years. This projection doesn't excite us and implies its newer products and services will not accelerate its top-line performance yet.
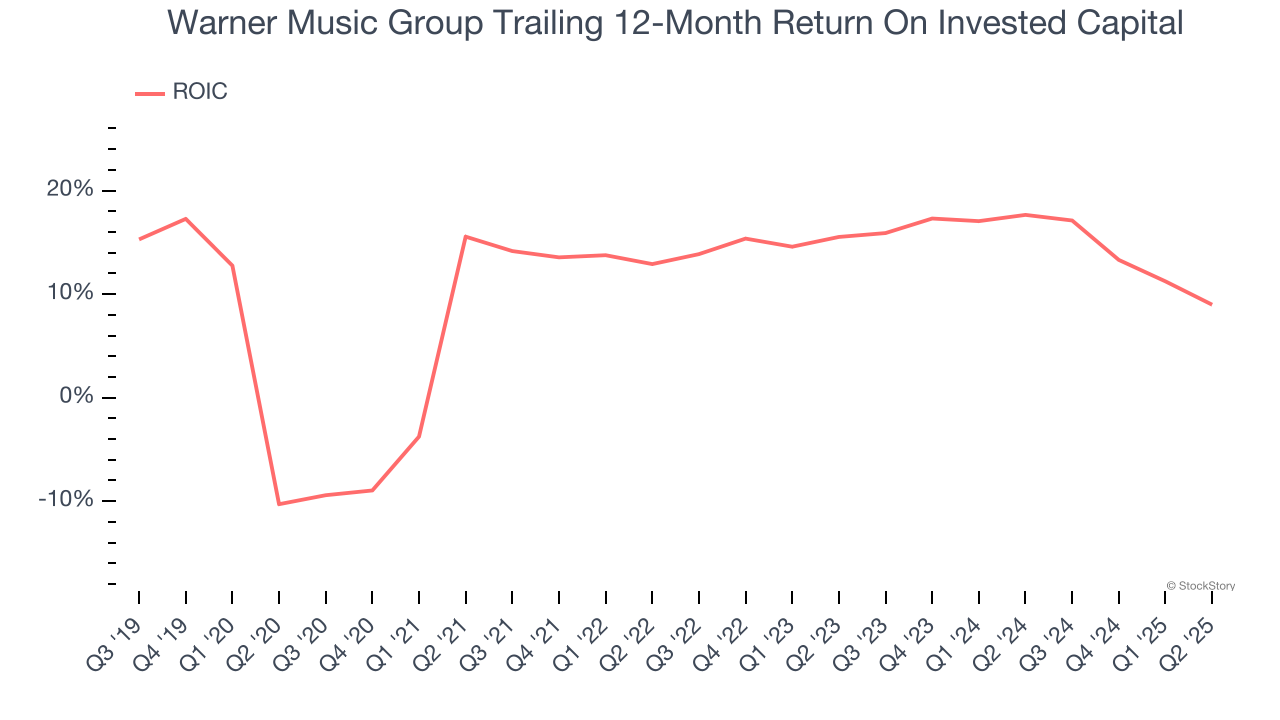
3. Previous Growth Initiatives Haven’t Impressed
Growth gives us insight into a company’s long-term potential, but how capital-efficient was that growth? A company’s ROIC explains this by showing how much operating profit it makes compared to the money it has raised (debt and equity).
Warner Music Group historically did a mediocre job investing in profitable growth initiatives. Its five-year average ROIC was 14.1%, somewhat low compared to the best consumer discretionary companies that consistently pump out 25%+.
Final Judgment
Warner Music Group isn’t a terrible business, but it doesn’t pass our bar. With its shares trailing the market in recent months, the stock trades at 20.8× forward P/E (or $30.43 per share). This valuation multiple is fair, but we don’t have much faith in the company. We're fairly confident there are better investments elsewhere. We’d recommend looking at the most dominant software business in the world.
Stocks We Like More Than Warner Music Group
If your portfolio success hinges on just 4 stocks, your wealth is built on fragile ground. You have a small window to secure high-quality assets before the market widens and these prices disappear.
Don’t wait for the next volatility shock. Check out our Top 5 Growth Stocks for this month. This is a curated list of our High Quality stocks that have generated a market-beating return of 244% over the last five years (as of June 30, 2025).
Stocks that made our list in 2020 include now familiar names such as Nvidia (+1,545% between March 2020 and March 2025) as well as under-the-radar businesses like the once-micro-cap company Tecnoglass (+1,754% five-year return). Find your next big winner with StockStory today.
StockStory is growing and hiring equity analyst and marketing roles. Are you a 0 to 1 builder passionate about the markets and AI? See the open roles here.