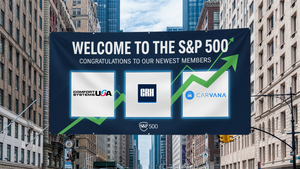
While the S&P 500 (^GSPC) includes industry leaders, not every stock in the index is a winner. Some companies are past their prime, weighed down by poor execution, weak financials, or structural headwinds.
Picking the right S&P 500 stocks requires more than just buying big names, and that’s where StockStory comes in. That said, here is one S&P 500 stock that is leading the market forward and two that could be in trouble.
Two Stocks to Sell:
Analog Devices (ADI)
Market Cap: $115.6 billion
Founded by two MIT graduates, Ray Stata and Matthew Lorber in 1965, Analog Devices (NASDAQ: ADI) is one of the largest providers of high performance analog integrated circuits used mainly in industrial end markets, along with communications, autos, and consumer devices.
Why Does ADI Fall Short?
- Customers postponed purchases of its products and services this cycle as its revenue declined by 10.1% annually over the last two years
- Low returns on capital reflect management’s struggle to allocate funds effectively, and its decreasing returns suggest its historical profit centers are aging
Analog Devices is trading at $234.99 per share, or 26x forward P/E. Dive into our free research report to see why there are better opportunities than ADI.
Church & Dwight (CHD)
Market Cap: $20.19 billion
Best known for its Arm & Hammer baking soda, Church & Dwight (NYSE: CHD) is a household and personal care products company with a vast portfolio that spans laundry detergent to toothbrushes to hair removal creams.
Why Does CHD Worry Us?
- Organic sales performance over the past two years indicates the company may need to make strategic adjustments or rely on M&A to catalyze faster growth
- Anticipated sales growth of 4.1% for the next year implies demand will be shaky
- Earnings growth underperformed the sector average over the last three years as its EPS grew by just 4.7% annually
At $84.20 per share, Church & Dwight trades at 23x forward P/E. If you’re considering CHD for your portfolio, see our FREE research report to learn more.
One Stock to Buy:
KLA Corporation (KLAC)
Market Cap: $149 billion
Formed by the 1997 merger of the two leading semiconductor yield management companies, KLA Corporation (NASDAQ: KLAC) is the leading supplier of equipment used to measure and inspect semiconductor chips.
Why Do We Love KLAC?
- Market share has increased this cycle as its 16.1% annual revenue growth over the last five years was exceptional
- Offerings are difficult to replicate at scale and lead to a best-in-class gross margin of 60.6%
- Robust free cash flow margin of 30.8% gives it many options for capital deployment
KLA Corporation’s stock price of $1,139 implies a valuation ratio of 31.5x forward P/E. Is now the right time to buy? Find out in our full research report, it’s free for active Edge members.
High-Quality Stocks for All Market Conditions
If your portfolio success hinges on just 4 stocks, your wealth is built on fragile ground. You have a small window to secure high-quality assets before the market widens and these prices disappear.
Don’t wait for the next volatility shock. Check out our Top 5 Strong Momentum Stocks for this week. This is a curated list of our High Quality stocks that have generated a market-beating return of 244% over the last five years (as of June 30, 2025).
Stocks that made our list in 2020 include now familiar names such as Nvidia (+1,326% between June 2020 and June 2025) as well as under-the-radar businesses like the once-micro-cap company Kadant (+351% five-year return). Find your next big winner with StockStory today for free. Find your next big winner with StockStory today. Find your next big winner with StockStory today
StockStory is growing and hiring equity analyst and marketing roles. Are you a 0 to 1 builder passionate about the markets and AI? See the open roles here.


