
Lamb Weston has been treading water for the past six months, recording a small return of 4.7% while holding steady at $56.06. The stock also fell short of the S&P 500’s 11.9% gain during that period.
Is there a buying opportunity in Lamb Weston, or does it present a risk to your portfolio? See what our analysts have to say in our full research report, it’s free for active Edge members.
Why Is Lamb Weston Not Exciting?
We don't have much confidence in Lamb Weston. Here are three reasons why LW doesn't excite us and a stock we'd rather own.
1. Projected Revenue Growth Shows Limited Upside
Forecasted revenues by Wall Street analysts signal a company’s potential. Predictions may not always be accurate, but accelerating growth typically boosts valuation multiples and stock prices while slowing growth does the opposite.
Over the next 12 months, sell-side analysts expect Lamb Weston’s revenue to stall, a deceleration versus This projection is underwhelming and implies its products will see some demand headwinds.
2. Low Gross Margin Reveals Weak Structural Profitability
At StockStory, we prefer high gross margin businesses because they indicate pricing power or differentiated products, giving the company a chance to generate higher operating profits.
Lamb Weston has bad unit economics for a consumer staples company, giving it less room to reinvest and develop new products. As you can see below, it averaged a 23.9% gross margin over the last two years. That means Lamb Weston paid its suppliers a lot of money ($76.13 for every $100 in revenue) to run its business. 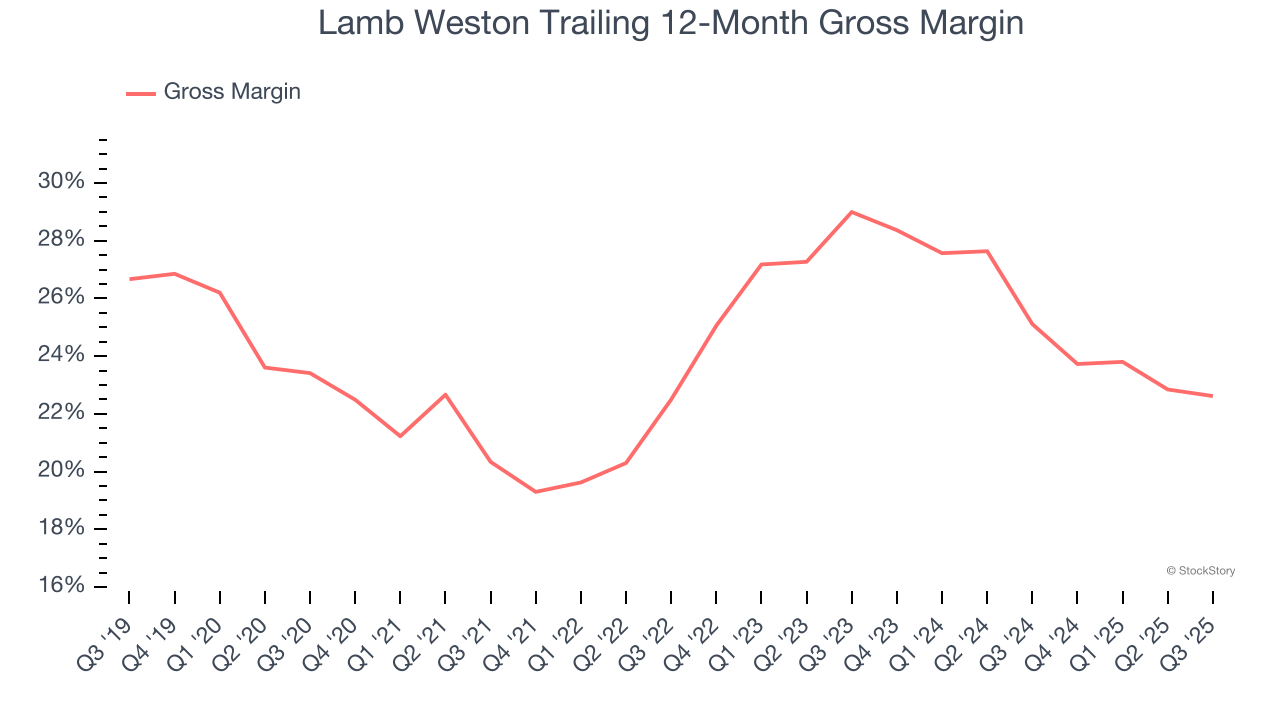
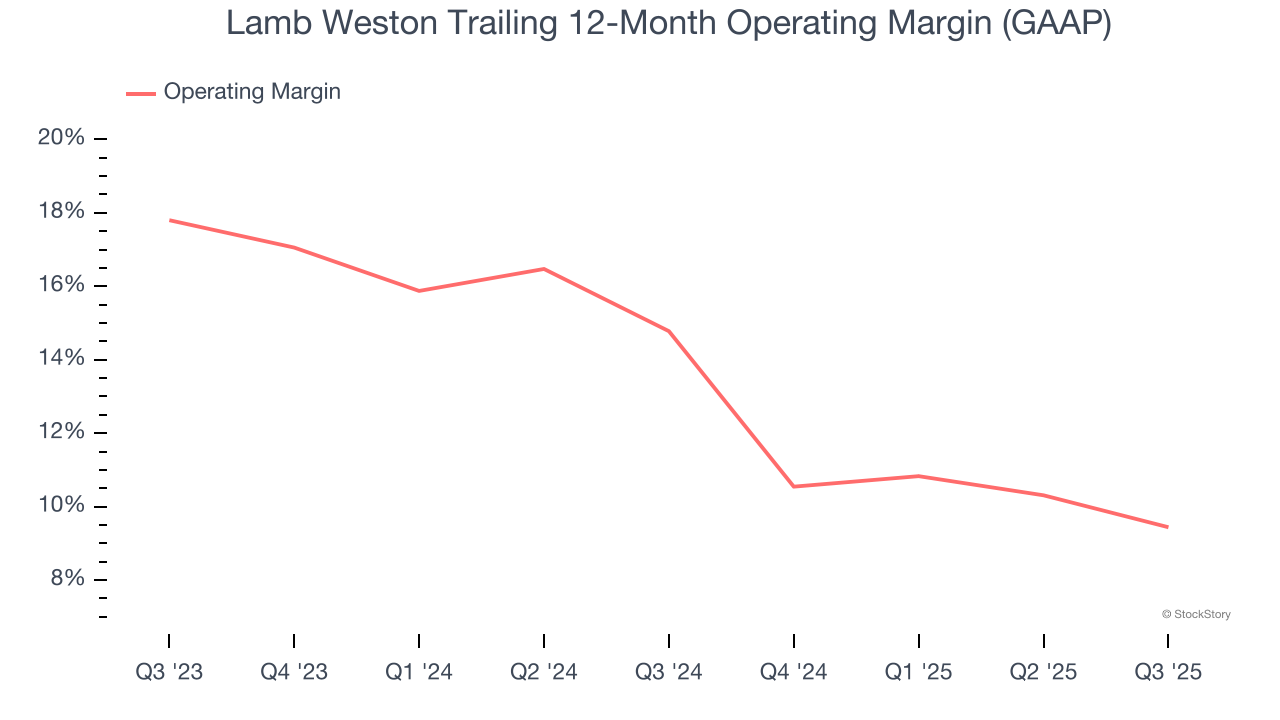
3. Shrinking Operating Margin
Operating margin is an important measure of profitability as it shows the portion of revenue left after accounting for all core expenses – everything from the cost of goods sold to advertising and wages. It’s also useful for comparing profitability across companies with different levels of debt and tax rates because it excludes interest and taxes.
Looking at the trend in its profitability, Lamb Weston’s operating margin decreased by 5.3 percentage points over the last year. This raises questions about the company’s expense base because its revenue growth should have given it leverage on its fixed costs, resulting in better economies of scale and profitability. Its operating margin for the trailing 12 months was 9.4%.
Final Judgment
Lamb Weston’s business quality ultimately falls short of our standards. With its shares lagging the market recently, the stock trades at 17.8× forward P/E (or $56.06 per share). Beauty is in the eye of the beholder, but our analysis shows the upside isn’t great compared to the potential downside. We're fairly confident there are better investments elsewhere. We’d recommend looking at one of our top software and edge computing picks.
Stocks We Like More Than Lamb Weston
If your portfolio success hinges on just 4 stocks, your wealth is built on fragile ground. You have a small window to secure high-quality assets before the market widens and these prices disappear.
Don’t wait for the next volatility shock. Check out our Top 5 Growth Stocks for this month. This is a curated list of our High Quality stocks that have generated a market-beating return of 244% over the last five years (as of June 30, 2025).
Stocks that have made our list include now familiar names such as Nvidia (+1,326% between June 2020 and June 2025) as well as under-the-radar businesses like the once-small-cap company Comfort Systems (+782% five-year return). Find your next big winner with StockStory today.
StockStory is growing and hiring equity analyst and marketing roles. Are you a 0 to 1 builder passionate about the markets and AI? See the open roles here.


