
Multi-industry consumer and professional products manufacturer Griffon Corporation (NYSE: GFF) reported Q3 CY2025 results exceeding the market’s revenue expectations, but sales were flat year on year at $662.2 million. On the other hand, the company’s full-year revenue guidance of $2.5 billion at the midpoint came in 1.5% below analysts’ estimates. Its non-GAAP profit of $1.54 per share was 1.7% above analysts’ consensus estimates.
Is now the time to buy Griffon? Find out by accessing our full research report, it’s free for active Edge members.
Griffon (GFF) Q3 CY2025 Highlights:
- Revenue: $662.2 million vs analyst estimates of $631.5 million (flat year on year, 4.9% beat)
- Adjusted EPS: $1.54 vs analyst estimates of $1.52 (1.7% beat)
- Adjusted EBITDA: $137.9 million vs analyst estimates of $136 million (20.8% margin, 1.4% beat)
- EBITDA guidance for the upcoming financial year 2026 is $590 million at the midpoint, above analyst estimates of $549.6 million
- Operating Margin: 18%, in line with the same quarter last year
- Free Cash Flow Margin: 9.4%, up from 8% in the same quarter last year
- Market Capitalization: $3.11 billion
Company Overview
Initially in the defense industry, Griffon (NYSE: GFF) is a now diversified company specializing in home improvement, professional equipment, and building products.
Revenue Growth
A company’s long-term sales performance is one signal of its overall quality. Even a bad business can shine for one or two quarters, but a top-tier one grows for years. Unfortunately, Griffon’s 1.2% annualized revenue growth over the last five years was weak. This was below our standards and is a tough starting point for our analysis.
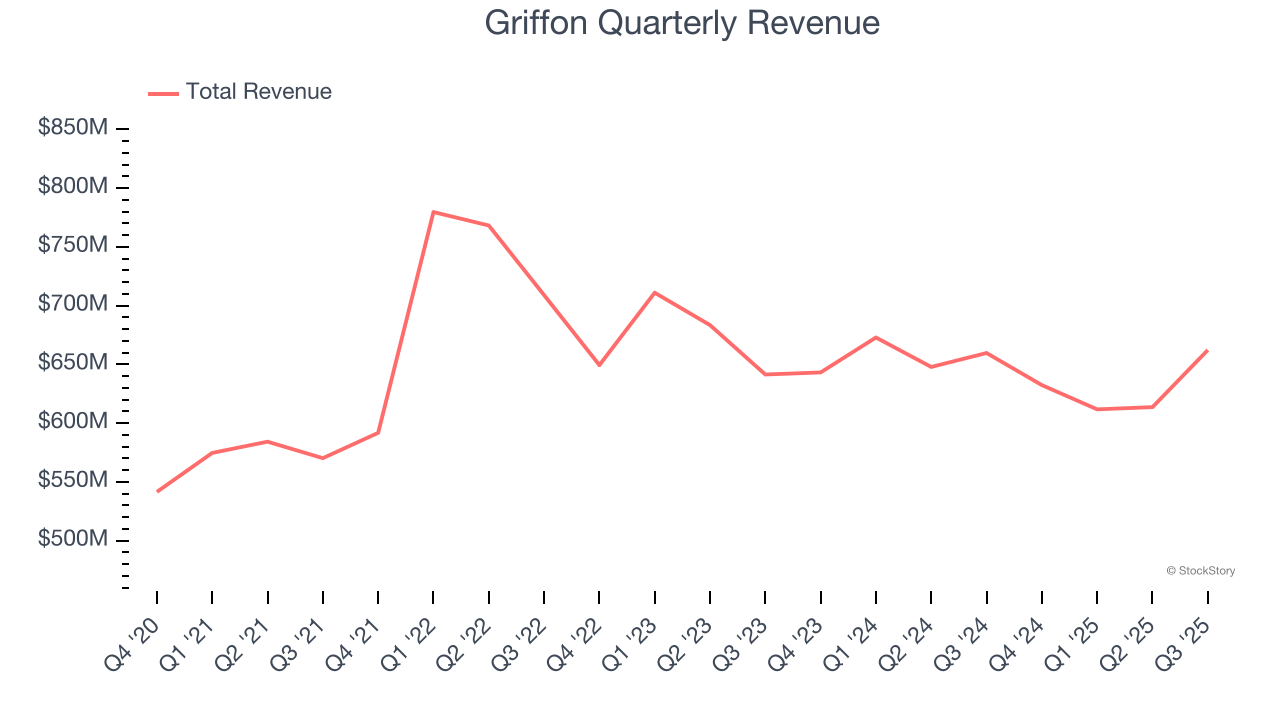
Long-term growth is the most important, but within industrials, a half-decade historical view may miss new industry trends or demand cycles. Griffon’s performance shows it grew in the past but relinquished its gains over the last two years, as its revenue fell by 3.1% annually. 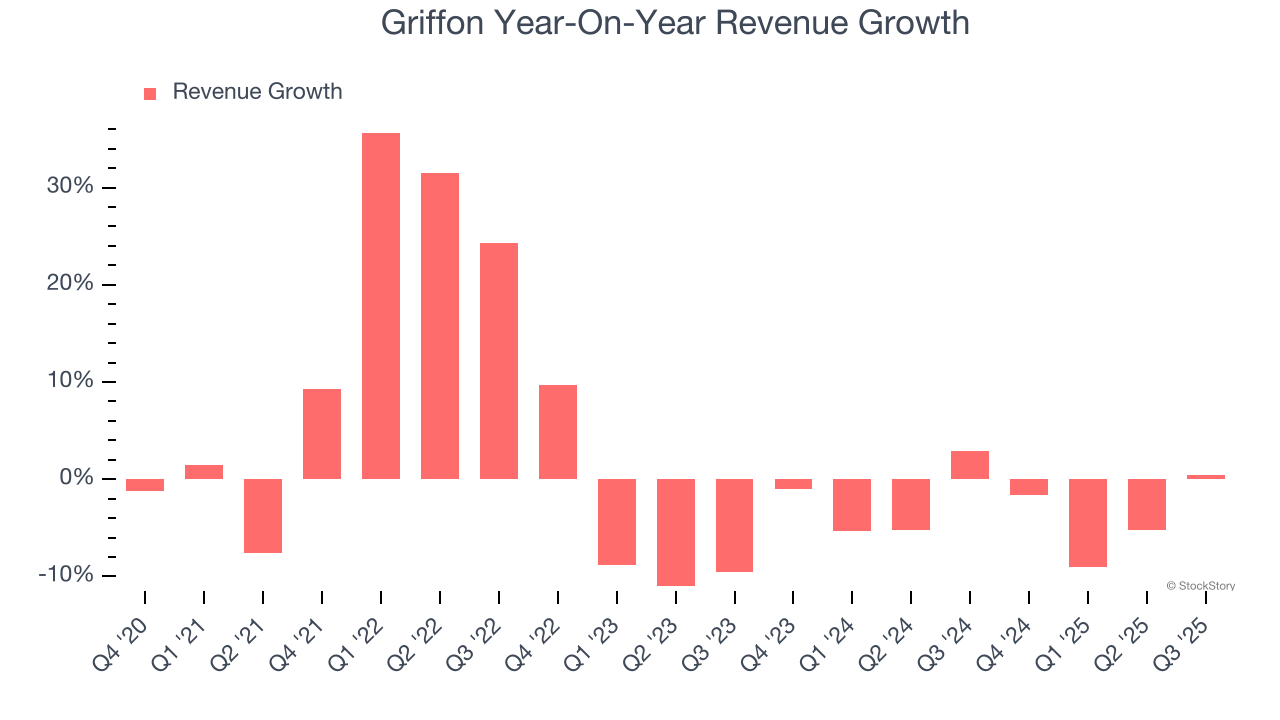
This quarter, Griffon’s $662.2 million of revenue was flat year on year but beat Wall Street’s estimates by 4.9%.
Looking ahead, sell-side analysts expect revenue to remain flat over the next 12 months. While this projection indicates its newer products and services will spur better top-line performance, it is still below the sector average.
Software is eating the world and there is virtually no industry left that has been untouched by it. That drives increasing demand for tools helping software developers do their jobs, whether it be monitoring critical cloud infrastructure, integrating audio and video functionality, or ensuring smooth content streaming. Click here to access a free report on our 3 favorite stocks to play this generational megatrend.
Operating Margin
Griffon has been an efficient company over the last five years. It was one of the more profitable businesses in the industrials sector, boasting an average operating margin of 14.2%. This result isn’t surprising as its high gross margin gives it a favorable starting point.
Analyzing the trend in its profitability, Griffon’s operating margin rose by 9.4 percentage points over the last five years, as its sales growth gave it operating leverage.
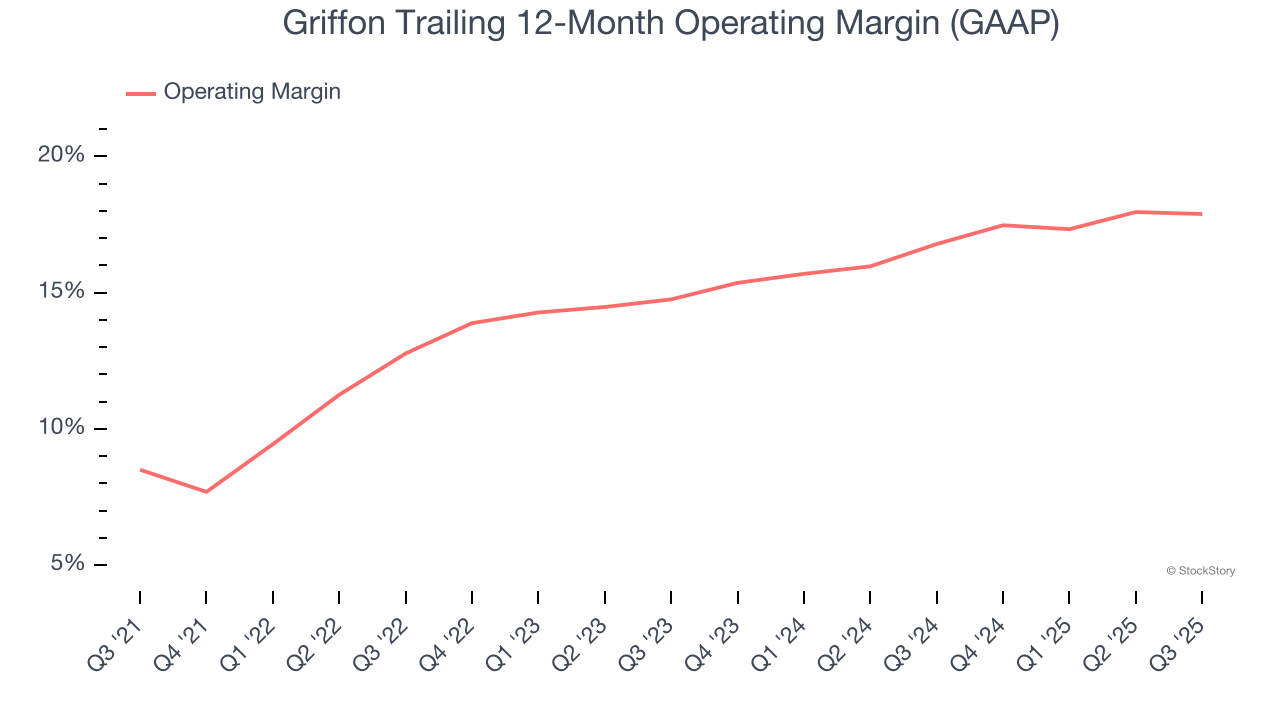
In Q3, Griffon generated an operating margin profit margin of 18%, in line with the same quarter last year. This indicates the company’s cost structure has recently been stable.
Earnings Per Share
Revenue trends explain a company’s historical growth, but the long-term change in earnings per share (EPS) points to the profitability of that growth – for example, a company could inflate its sales through excessive spending on advertising and promotions.
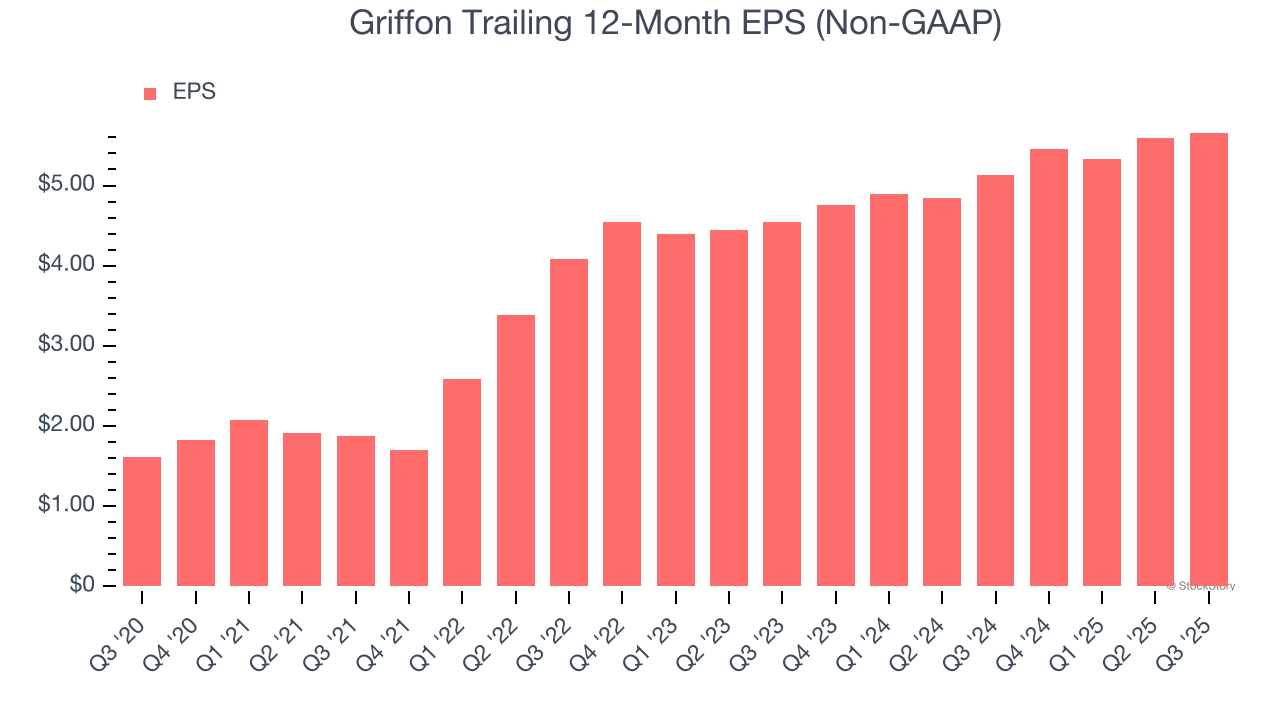
Griffon’s EPS grew at an astounding 28.4% compounded annual growth rate over the last five years, higher than its 1.2% annualized revenue growth. This tells us the company became more profitable on a per-share basis as it expanded.
Diving into the nuances of Griffon’s earnings can give us a better understanding of its performance. As we mentioned earlier, Griffon’s operating margin was flat this quarter but expanded by 9.4 percentage points over the last five years. This was the most relevant factor (aside from the revenue impact) behind its higher earnings; interest expenses and taxes can also affect EPS but don’t tell us as much about a company’s fundamentals.
Like with revenue, we analyze EPS over a more recent period because it can provide insight into an emerging theme or development for the business.
For Griffon, its two-year annual EPS growth of 11.5% was lower than its five-year trend. We still think its growth was good and hope it can accelerate in the future.
In Q3, Griffon reported adjusted EPS of $1.54, up from $1.47 in the same quarter last year. This print beat analysts’ estimates by 1.7%. Over the next 12 months, Wall Street expects Griffon’s full-year EPS of $5.66 to grow 10.8%.
Key Takeaways from Griffon’s Q3 Results
We were impressed by how significantly Griffon blew past analysts’ revenue expectations this quarter. We were also glad its full-year EBITDA guidance trumped Wall Street’s estimates. On the other hand, its full-year revenue guidance slightly missed. Overall, this print was mixed. The stock remained flat at $66.50 immediately after reporting.
So do we think Griffon is an attractive buy at the current price? We think that the latest quarter is only one piece of the longer-term business quality puzzle. Quality, when combined with valuation, can help determine if the stock is a buy. We cover that in our actionable full research report which you can read here, it’s free for active Edge members.


