General merchandise retailer Target (NYSE: TGT) met Wall Streets revenue expectations in Q3 CY2025, but sales fell by 1.6% year on year to $25.27 billion. Its non-GAAP profit of $1.78 per share was 3.6% above analysts’ consensus estimates.
Is now the time to buy Target? Find out by accessing our full research report, it’s free for active Edge members.
Target (TGT) Q3 CY2025 Highlights:
- Revenue: $25.27 billion vs analyst estimates of $25.32 billion (1.6% year-on-year decline, in line)
- Adjusted EPS: $1.78 vs analyst estimates of $1.72 (3.6% beat)
- Management lowered its full-year Adjusted EPS guidance to $7.50 at the midpoint, a 6.3% decrease
- Operating Margin: 3.8%, in line with the same quarter last year
- Free Cash Flow Margin: 0.6%, similar to the same quarter last year
- Locations: 1,995 at quarter end, up from 1,978 in the same quarter last year
- Same-Store Sales fell 2.7% year on year (0.3% in the same quarter last year)
- Market Capitalization: $40.23 billion
"Thanks to the incredible work and dedication of the Target team, our third quarter performance was in line with our expectations, despite multiple challenges continuing to face our business," said Michael Fiddelke, incoming Chief Executive Officer of Target.
Company Overview
With a higher focus on style and aesthetics compared to other large general merchandise retailers, Target (NYSE: TGT) serves the suburban consumer who is looking for a wide range of products under one roof.
Revenue Growth
A company’s long-term performance is an indicator of its overall quality. Any business can put up a good quarter or two, but the best consistently grow over the long haul.
With $105.2 billion in revenue over the past 12 months, Target is a behemoth in the consumer retail sector and benefits from economies of scale, giving it an edge in distribution. This also enables it to gain more leverage on its fixed costs than smaller competitors and the flexibility to offer lower prices. However, its scale is a double-edged sword because it’s harder to find incremental growth when you’ve penetrated most of the market. To accelerate sales, Target likely needs to optimize its pricing or lean into international expansion.
As you can see below, Target grew its sales at a tepid 5.2% compounded annual growth rate over the last six years (we compare to 2019 to normalize for COVID-19 impacts) as it didn’t open many new stores.
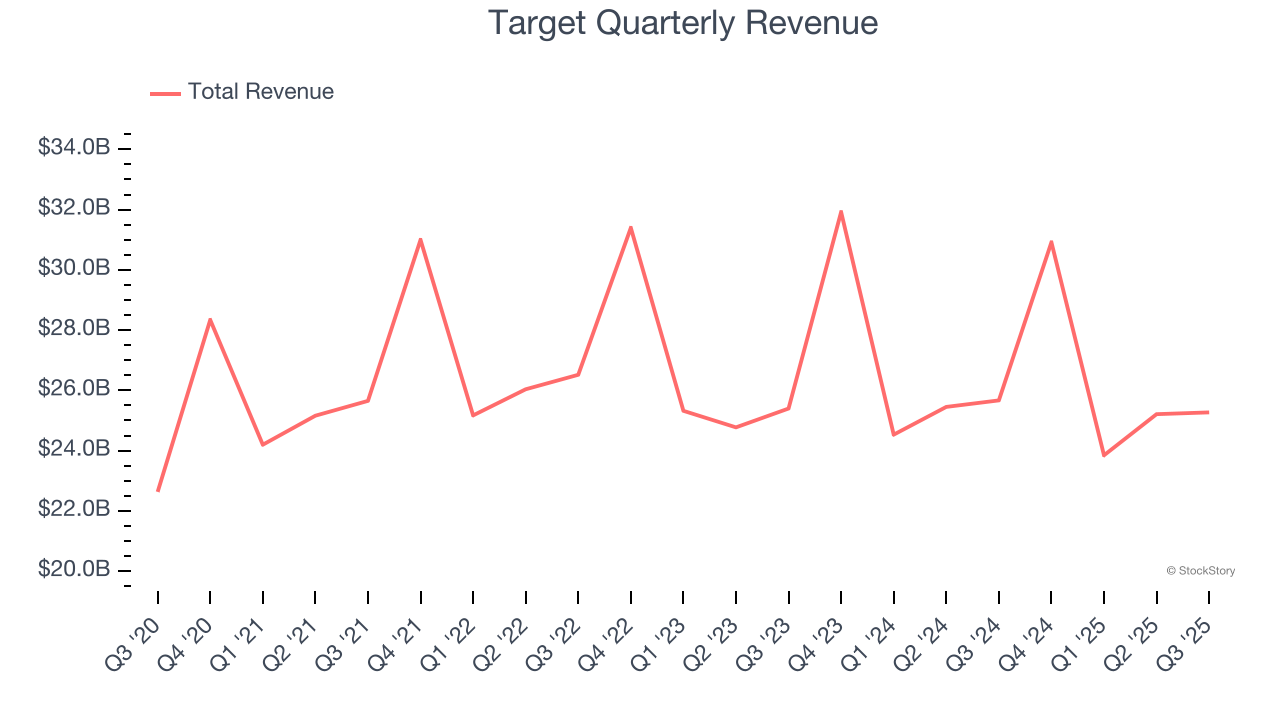
This quarter, Target reported a rather uninspiring 1.6% year-on-year revenue decline to $25.27 billion of revenue, in line with Wall Street’s estimates.
Looking ahead, sell-side analysts expect revenue to grow 1.2% over the next 12 months, a deceleration versus the last six years. This projection doesn't excite us and implies its products will face some demand challenges.
The 1999 book Gorilla Game predicted Microsoft and Apple would dominate tech before it happened. Its thesis? Identify the platform winners early. Today, enterprise software companies embedding generative AI are becoming the new gorillas. a profitable, fast-growing enterprise software stock that is already riding the automation wave and looking to catch the generative AI next.
Store Performance
Number of Stores
A retailer’s store count influences how much it can sell and how quickly revenue can grow.
Target listed 1,995 locations in the latest quarter and has kept its store count flat over the last two years while other consumer retail businesses have opted for growth.
When a retailer keeps its store footprint steady, it usually means demand is stable and it’s focusing on operational efficiency to increase profitability.

Same-Store Sales
A company's store base only paints one part of the picture. When demand is high, it makes sense to open more. But when demand is low, it’s prudent to close some locations and use the money in other ways. Same-store sales gives us insight into this topic because it measures organic growth for a retailer's e-commerce platform and brick-and-mortar shops that have existed for at least a year.
Target’s demand has been shrinking over the last two years as its same-store sales have averaged 1.6% annual declines. This performance isn’t ideal, and we’d be concerned if Target starts opening new stores to artificially boost revenue growth.
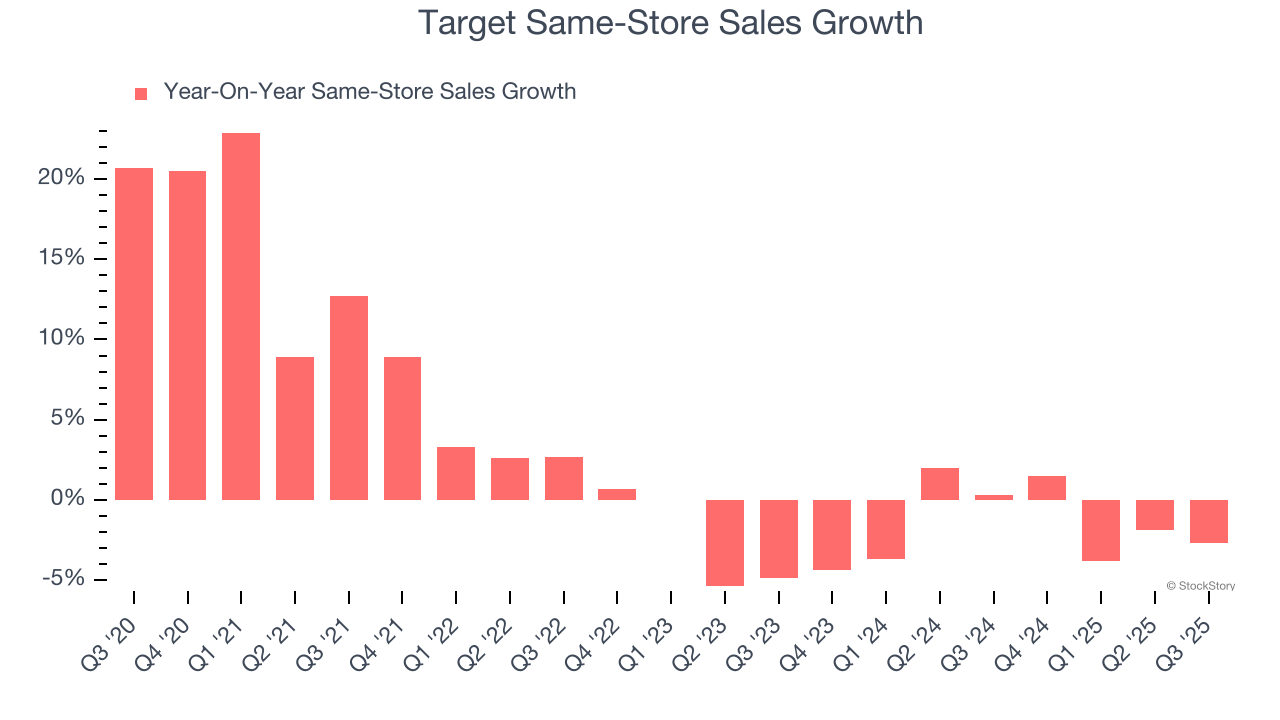
In the latest quarter, Target’s same-store sales fell by 2.7% year on year. This decrease represents a further deceleration from its historical levels. We hope the business can get back on track.
Key Takeaways from Target’s Q3 Results
It was great to see Target’s EPS outperform Wall Street’s estimates. On the other hand, the company lowered full-year EPS guidance as the retailer saw uneven spending and shoppers looking for more value. Overall, this was a mixed quarter. The stock traded down 1.4% to $87.32 immediately following the results.
Is Target an attractive investment opportunity right now? What happened in the latest quarter matters, but not as much as longer-term business quality and valuation, when deciding whether to invest in this stock. We cover that in our actionable full research report which you can read here, it’s free for active Edge members.


