
Vocational education Universal Technical Institute (NYSE: UTI) beat Wall Street’s revenue expectations in Q3 CY2025, with sales up 13.3% year on year to $222.4 million. The company’s full-year revenue guidance of $910 million at the midpoint came in 0.9% above analysts’ estimates. Its GAAP profit of $0.34 per share was 32.5% above analysts’ consensus estimates.
Is now the time to buy Universal Technical Institute? Find out by accessing our full research report, it’s free for active Edge members.
Universal Technical Institute (UTI) Q3 CY2025 Highlights:
- Revenue: $222.4 million vs analyst estimates of $219.5 million (13.3% year-on-year growth, 1.3% beat)
- EPS (GAAP): $0.34 vs analyst estimates of $0.26 (32.5% beat)
- Adjusted EBITDA: $36.78 million vs analyst estimates of $36.29 million (16.5% margin, 1.4% beat)
- EPS (GAAP) guidance for the upcoming financial year 2026 is $0.76 at the midpoint, missing analyst estimates by 19.4%
- EBITDA guidance for the upcoming financial year 2026 is $116.5 million at the midpoint, below analyst estimates of $118.6 million
- Operating Margin: 11.2%, down from 13.3% in the same quarter last year
- Free Cash Flow Margin: 18.3%, down from 30.6% in the same quarter last year
- New Students: 12,109, up 617 year on year
- Market Capitalization: $1.58 billion
"Fiscal 2025 was an exceptional year for Universal Technical Institute and a defining start to the second phase of our North Star strategy," said Jerome Grant, CEO of Universal Technical Institute, Inc.
Company Overview
Founded in 1965, Universal Technical Institute (NYSE: UTI) is a leading provider of technical training programs, specializing in automotive, diesel, collision repair, motorcycle, and marine technicians.
Revenue Growth
Reviewing a company’s long-term sales performance reveals insights into its quality. Any business can have short-term success, but a top-tier one grows for years. Thankfully, Universal Technical Institute’s 22.7% annualized revenue growth over the last five years was impressive. Its growth beat the average consumer discretionary company and shows its offerings resonate with customers.
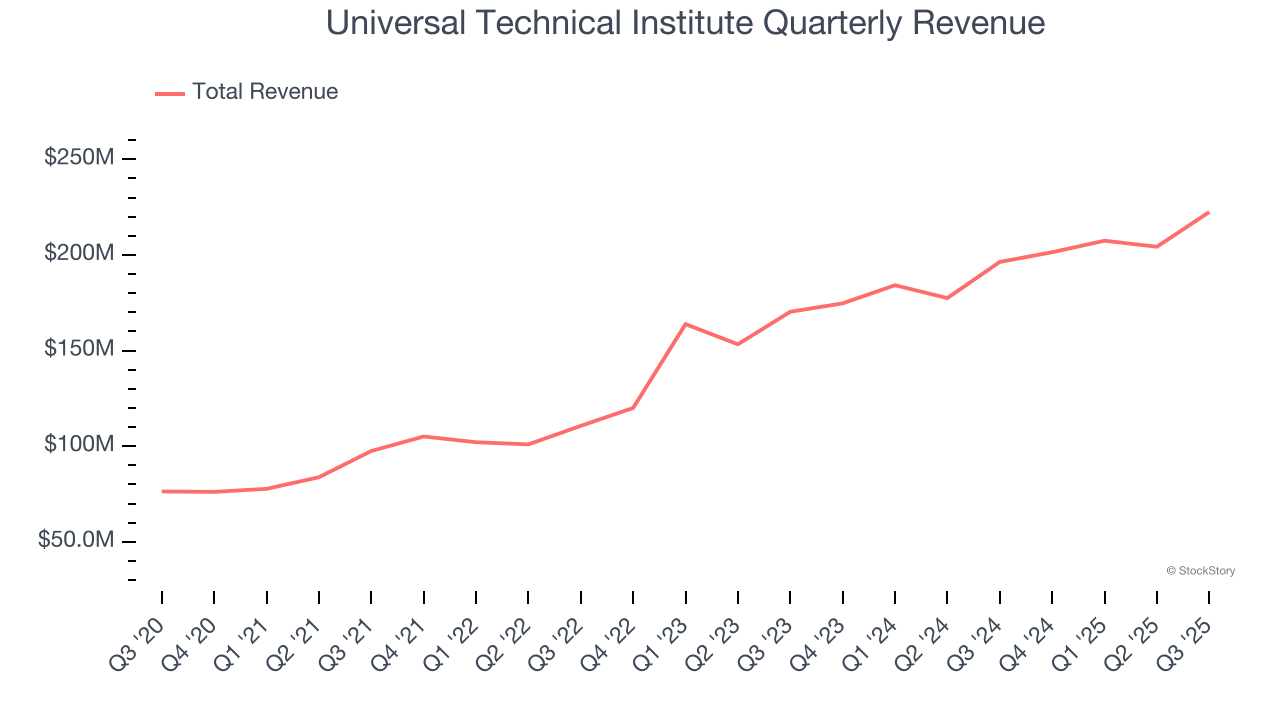
We at StockStory place the most emphasis on long-term growth, but within consumer discretionary, a stretched historical view may miss a company riding a successful new product or trend. Universal Technical Institute’s annualized revenue growth of 17.3% over the last two years is below its five-year trend, but we still think the results were respectable. 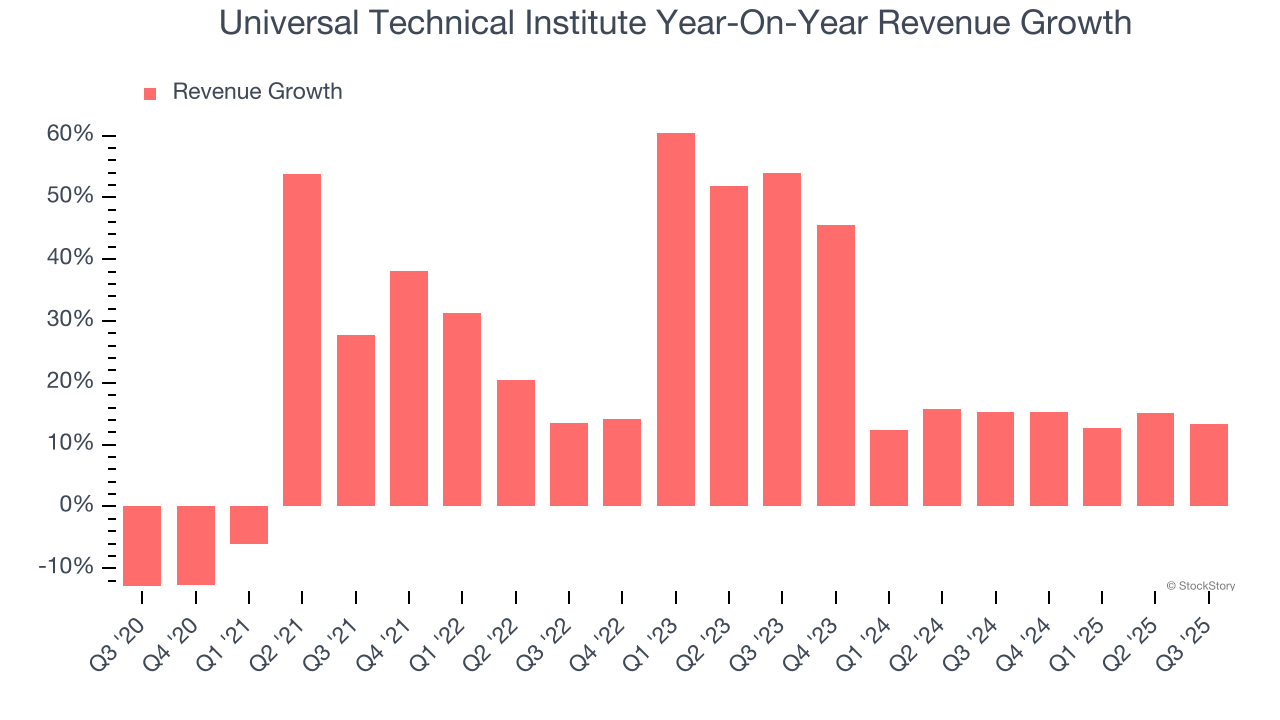
We can better understand the company’s revenue dynamics by analyzing its number of new students, which reached 12,109 in the latest quarter. Over the last two years, Universal Technical Institute’s new students averaged 21.9% year-on-year growth. Because this number is higher than its revenue growth during the same period, we can see the company’s monetization has fallen. 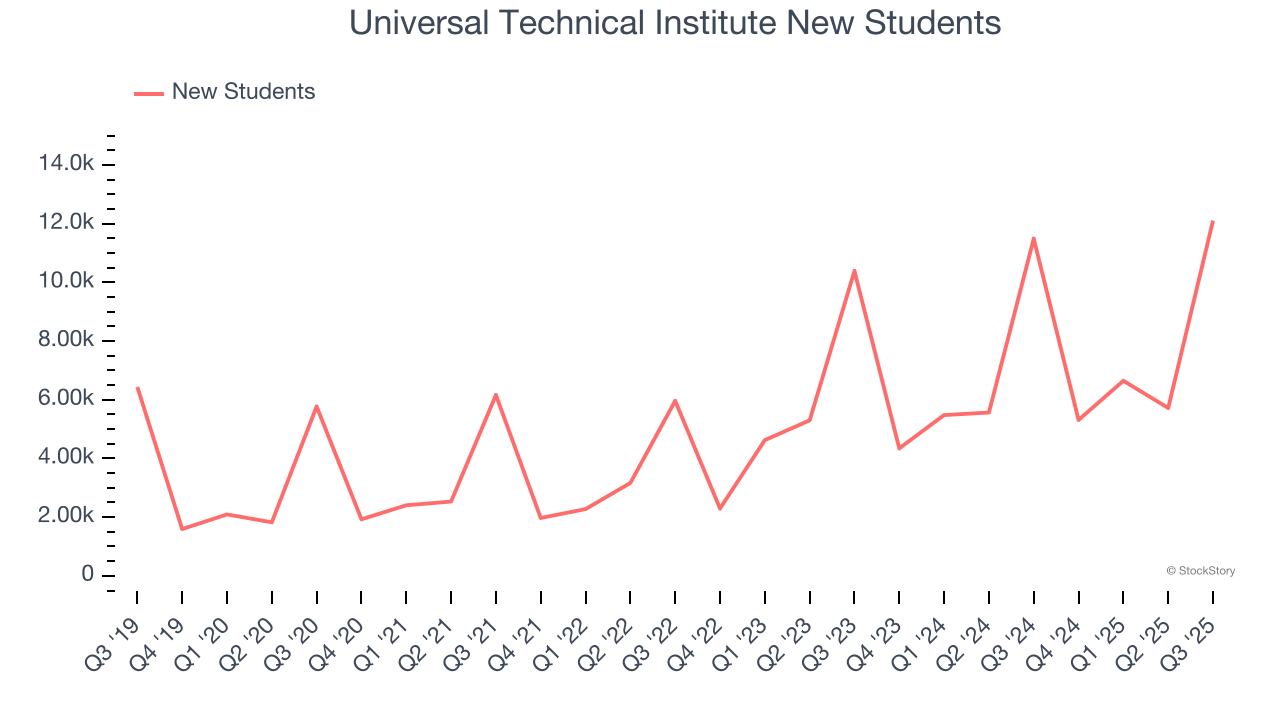
This quarter, Universal Technical Institute reported year-on-year revenue growth of 13.3%, and its $222.4 million of revenue exceeded Wall Street’s estimates by 1.3%.
Looking ahead, sell-side analysts expect revenue to grow 7.9% over the next 12 months, a deceleration versus the last two years. This projection is underwhelming and suggests its products and services will face some demand challenges.
While Wall Street chases Nvidia at all-time highs, an under-the-radar semiconductor supplier is dominating a critical AI component these giants can’t build without. Click here to access our free report one of our favorites growth stories.
Operating Margin
Universal Technical Institute’s operating margin has been trending up over the last 12 months and averaged 9.1% over the last two years. The company’s higher efficiency is a breath of fresh air, but its suboptimal cost structure means it still sports mediocre profitability for a consumer discretionary business.
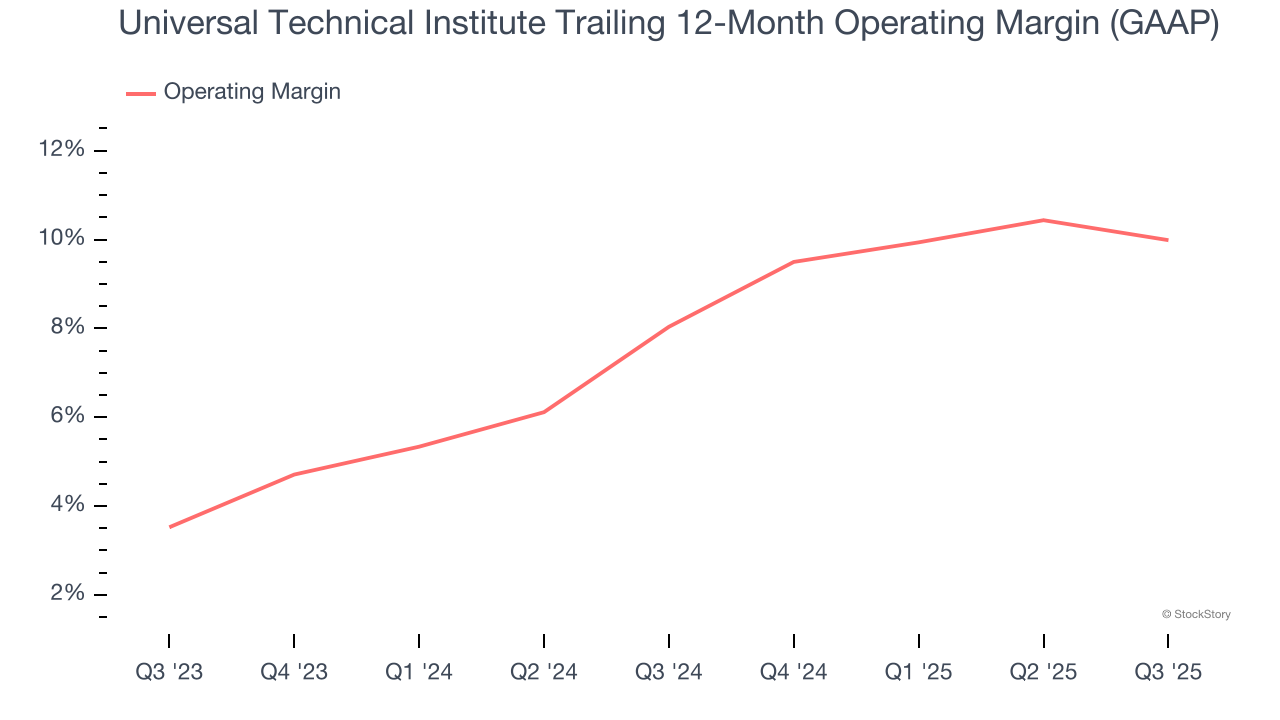
This quarter, Universal Technical Institute generated an operating margin profit margin of 11.2%, down 2 percentage points year on year. This contraction shows it was less efficient because its expenses grew faster than its revenue.
Earnings Per Share
We track the long-term change in earnings per share (EPS) for the same reason as long-term revenue growth. Compared to revenue, however, EPS highlights whether a company’s growth is profitable.
Universal Technical Institute’s full-year EPS flipped from negative to positive over the last five years. This is encouraging and shows it’s at a critical moment in its life.
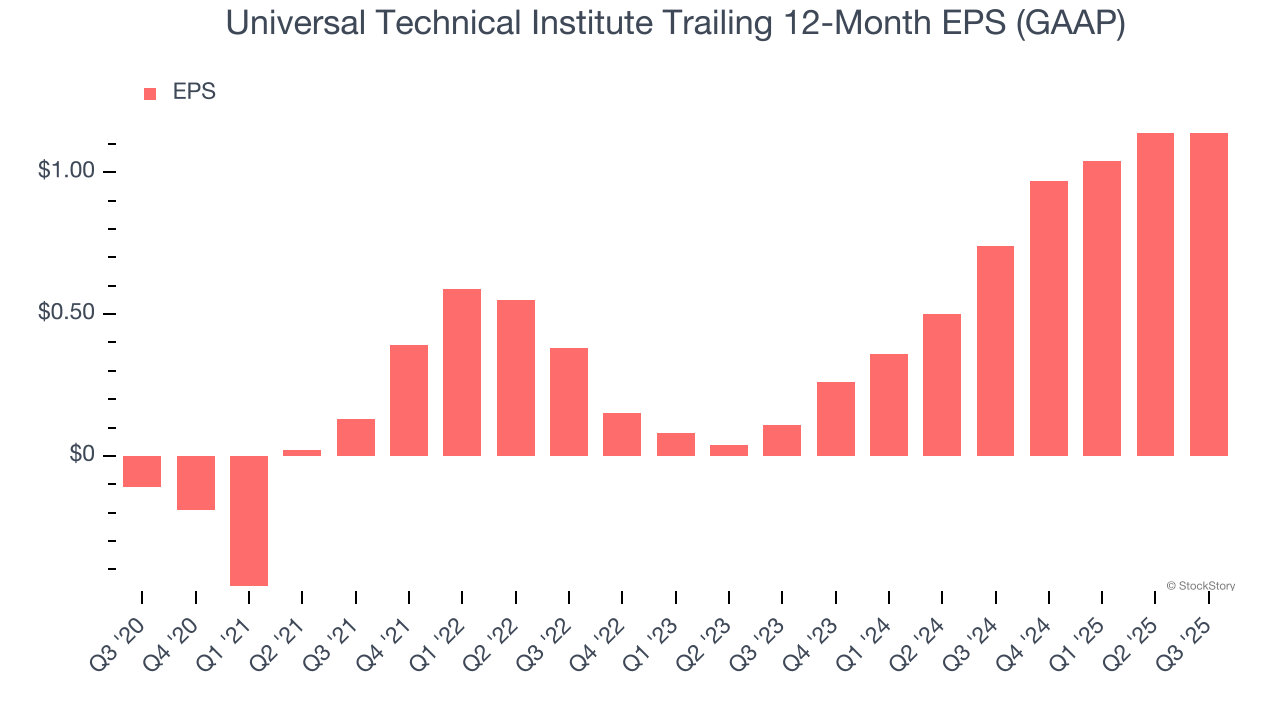
In Q3, Universal Technical Institute reported EPS of $0.34, in line with the same quarter last year. This print easily cleared analysts’ estimates, and shareholders should be content with the results. Over the next 12 months, Wall Street expects Universal Technical Institute’s full-year EPS of $1.14 to shrink by 17.5%.
Key Takeaways from Universal Technical Institute’s Q3 Results
It was good to see Universal Technical Institute beat analysts’ EPS expectations this quarter. We were also glad its full-year revenue guidance slightly exceeded Wall Street’s estimates. On the other hand, its full-year EBITDA guidance missed. Overall, this print had some key positives. Investors were likely hoping for more, and shares traded down 1.5% to $29.07 immediately after reporting.
So do we think Universal Technical Institute is an attractive buy at the current price? The latest quarter does matter, but not nearly as much as longer-term fundamentals and valuation, when deciding if the stock is a buy. We cover that in our actionable full research report which you can read here, it’s free for active Edge members.


