
Retail behemoth Walmart (NYSE: WMT) announced better-than-expected revenue in Q3 CY2025, with sales up 5.8% year on year to $179.5 billion. Its non-GAAP profit of $0.62 per share was 3.2% above analysts’ consensus estimates.
Is now the time to buy Walmart? Find out by accessing our full research report, it’s free for active Edge members.
Walmart (WMT) Q3 CY2025 Highlights:
- Revenue: $179.5 billion vs analyst estimates of $177.5 billion (5.8% year-on-year growth, 1.1% beat)
- Adjusted EPS: $0.62 vs analyst estimates of $0.60 (3.2% beat)
- Management raised its full-year Adjusted EPS guidance to $2.61 at the midpoint, a 1.4% increase
- Operating Margin: 3.7%, in line with the same quarter last year
- Free Cash Flow Margin: 1%, similar to the same quarter last year
- Same-Store Sales rose 4.5% year on year (5.5% in the same quarter last year)
- Market Capitalization: $802.1 billion
Company Overview
Known for its large-format Supercenters, Walmart (NYSE: WMT) is a retail pioneer that serves a budget-conscious consumer who is looking for a wide range of products under one roof.
Revenue Growth
Reviewing a company’s long-term sales performance reveals insights into its quality. Any business can experience short-term success, but top-performing ones enjoy sustained growth for years.
With $703.1 billion in revenue over the past 12 months, Walmart is a behemoth in the consumer retail sector and benefits from economies of scale, giving it an edge in distribution. This also enables it to gain more leverage on its fixed costs than smaller competitors and the flexibility to offer lower prices. However, its scale is a double-edged sword because it’s harder to find incremental growth when you’ve penetrated most of the market. To accelerate sales, Walmart likely needs to optimize its pricing or lean into international expansion.
As you can see below, Walmart grew its sales at a tepid 5.1% compounded annual growth rate over the last six years (we compare to 2019 to normalize for COVID-19 impacts), but to its credit, it opened new stores and increased sales at existing, established locations.
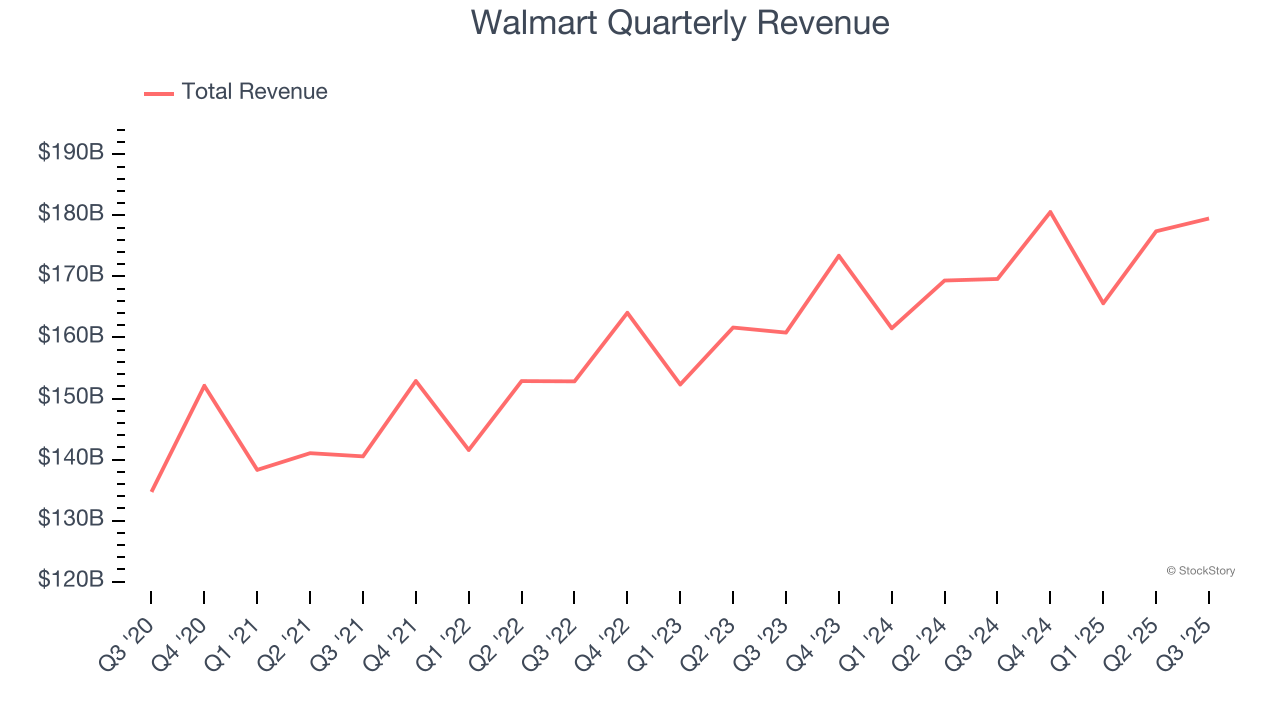
This quarter, Walmart reported year-on-year revenue growth of 5.8%, and its $179.5 billion of revenue exceeded Wall Street’s estimates by 1.1%.
Looking ahead, sell-side analysts expect revenue to grow 4.6% over the next 12 months, similar to its six-year rate. This projection is particularly noteworthy for a company of its scale and indicates the market is forecasting success for its products.
Software is eating the world and there is virtually no industry left that has been untouched by it. That drives increasing demand for tools helping software developers do their jobs, whether it be monitoring critical cloud infrastructure, integrating audio and video functionality, or ensuring smooth content streaming. Click here to access a free report on our 3 favorite stocks to play this generational megatrend.
Store Performance
Number of Stores
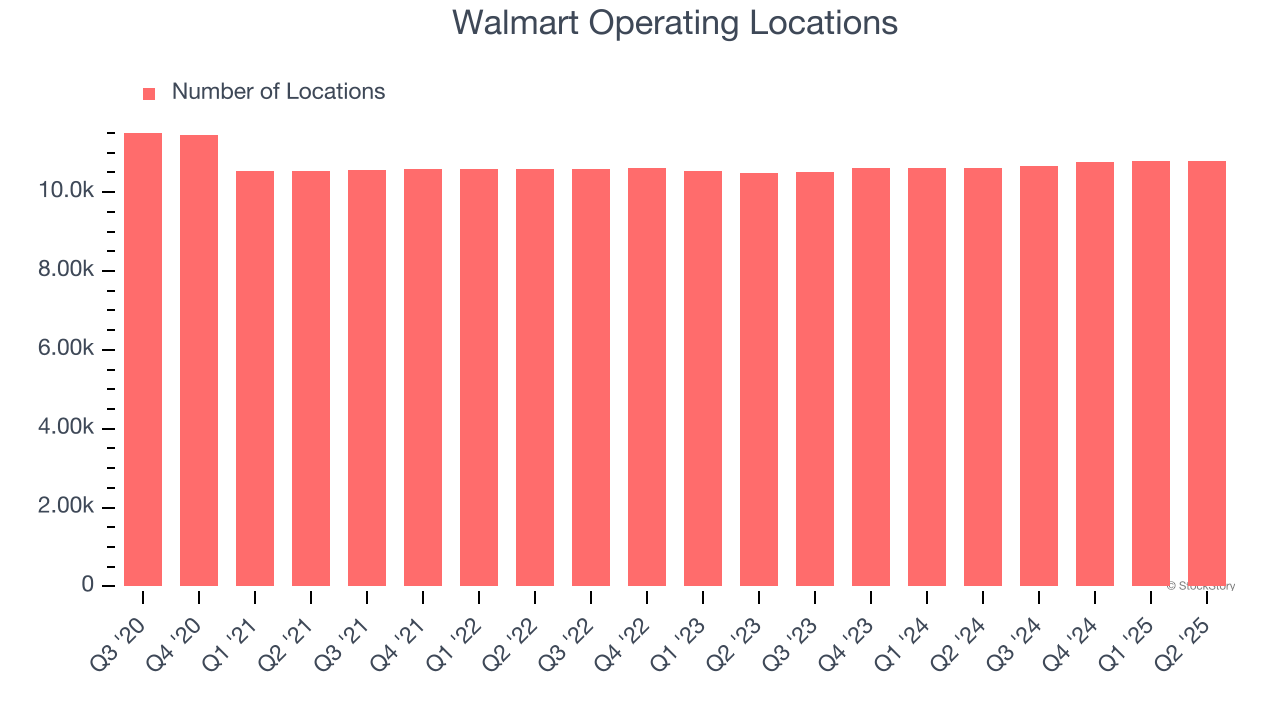
Over the last two years, Walmart has generally opened new stores, averaging 1.2% annual growth. This was faster than the broader consumer retail sector.
When a retailer opens new stores, it usually means it’s investing for growth because demand is greater than supply, especially in areas where consumers may not have a store within reasonable driving distance.
Note that Walmart reports its store count intermittently, so some data points are missing in the chart below.
Same-Store Sales
The change in a company's store base only tells one side of the story. The other is the performance of its existing locations and e-commerce sales, which informs management teams whether they should expand or downsize their physical footprints. Same-store sales is an industry measure of whether revenue is growing at those existing stores and is driven by customer visits (often called traffic) and the average spending per customer (ticket).
Walmart has been one of the most successful retailers over the last two years thanks to skyrocketing demand within its existing locations. On average, the company has posted exceptional year-on-year same-store sales growth of 4.6%. This performance suggests its measured rollout of new stores is beneficial for shareholders. We like this backdrop because it gives Walmart multiple ways to win: revenue growth can come from new stores, e-commerce, or increased foot traffic and higher sales per customer at existing locations.
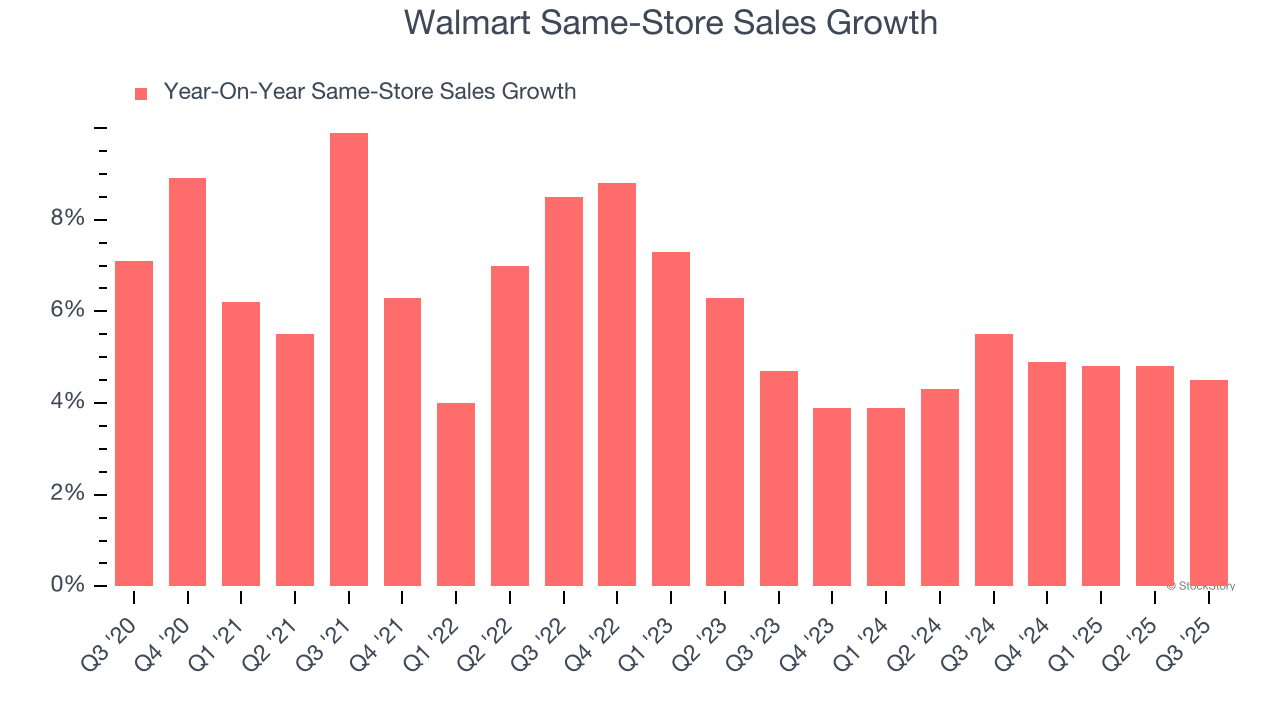
In the latest quarter, Walmart’s same-store sales rose 4.5% year on year. This performance was more or less in line with its historical levels.
Key Takeaways from Walmart’s Q3 Results
It was encouraging to see Walmart beat analysts’ revenue expectations this quarter on healthy same-store sales growth. We were also happy its gross margin outperformed Wall Street’s estimates. The last positive was that the company lifted full-year guidance. The company saw some weakness when Supplemental Nutrition Assistance Program (SNAP) benefits were paused during the government shutdown. Overall, this was a decent quarter. The market seemed to be expecting more though, and the stock traded down 2.2% to $98.45 immediately following the results.
So should you invest in Walmart right now? When making that decision, it’s important to consider its valuation, business qualities, as well as what has happened in the latest quarter. We cover that in our actionable full research report which you can read here, it’s free for active Edge members.


