ETFOptimize | High-performance ETF-based Investment Strategies

Quantitative strategies, Wall Street-caliber research, and insightful market analysis since 1998.


ETFOptimize | HOME
Close Window

Paymentus (NYSE:PAY) Reports Upbeat Q3, Stock Jumps 11.3%

PAY Cover Image

Digital payment platform Paymentus (NYSE: PAY) reported Q3 CY2025 results exceeding the market’s revenue expectations, with sales up 34.2% year on year to $310.7 million. On top of that, next quarter’s revenue guidance ($309.5 million at the midpoint) was surprisingly good and 5.8% above what analysts were expecting. Its non-GAAP profit of $0.17 per share was 14.6% above analysts’ consensus estimates.

Is now the time to buy Paymentus? Find out by accessing our full research report, it’s free for active Edge members.

Paymentus (PAY) Q3 CY2025 Highlights:

  • Revenue: $310.7 million vs analyst estimates of $280.6 million (34.2% year-on-year growth, 10.7% beat)
  • Pre-tax Profit: $22.6 million (7.3% margin)
  • Adjusted EPS: $0.17 vs analyst estimates of $0.15 (14.6% beat)
  • Revenue Guidance for Q4 CY2025 is $309.5 million at the midpoint, above analyst estimates of $292.5 million
  • Market Capitalization: $3.58 billion
  • “Paymentus continued to execute in the third quarter with double-digit year-over-year growth in revenue, contribution profit and adjusted EBITDA, of 34.2%, 22.8% and 45.9%, respectively, driven by strong new implementations and customer demand. Our exceptional bookings year-to-date, along with our considerable backlog, provide us great visibility for the remainder of 2025 and 2026,” said Dushyant Sharma, Founder and CEO.

    Company Overview

    Founded in 2004 to simplify the complex world of bill payments, Paymentus (NYSE: PAY) provides a cloud-based platform that helps utilities, municipalities, and service providers automate billing and payment processes.

    Revenue Growth

    A company’s long-term sales performance is one signal of its overall quality. Even a bad business can shine for one or two quarters, but a top-tier one grows for years. Over the last five years, Paymentus grew its revenue at an incredible 31.6% compounded annual growth rate. Its growth surpassed the average financials company and shows its offerings resonate with customers, a great starting point for our analysis.

    Paymentus Quarterly Revenue

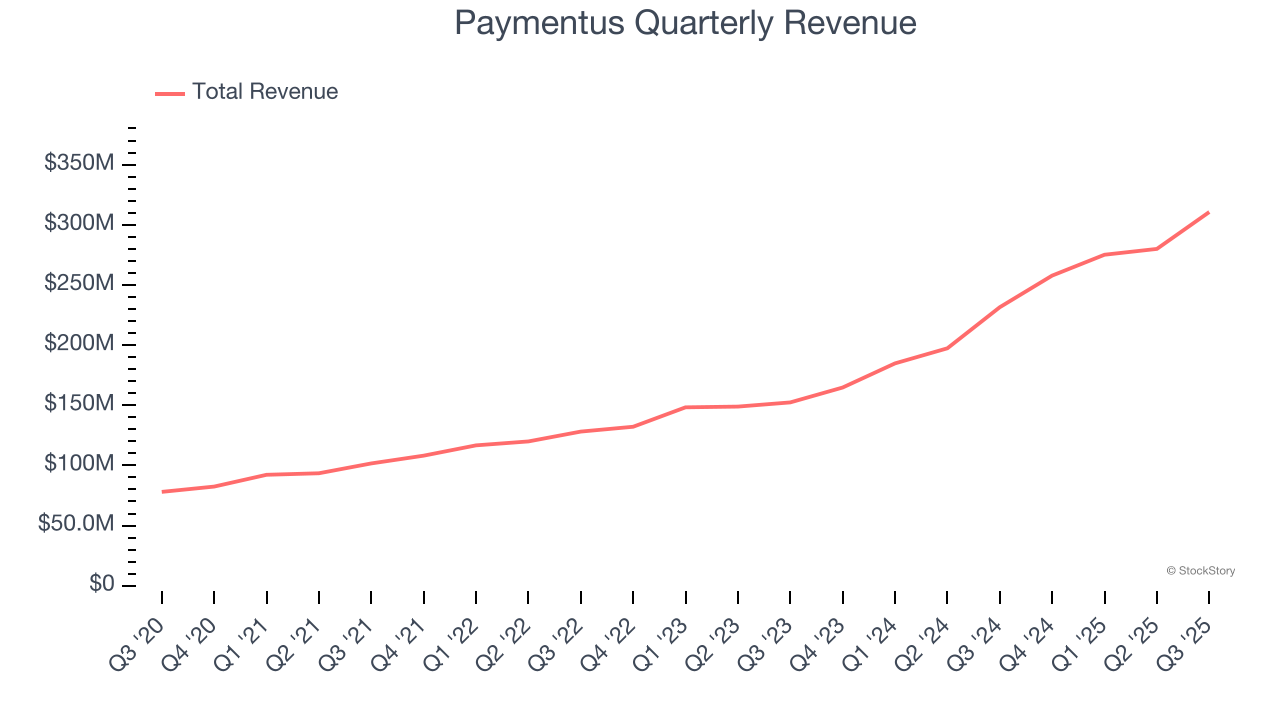
    Long-term growth is the most important, but within financials, a half-decade historical view may miss recent interest rate changes and market returns. Paymentus’s annualized revenue growth of 39% over the last two years is above its five-year trend, suggesting its demand was strong and recently accelerated. Paymentus Year-On-Year Revenue Growth

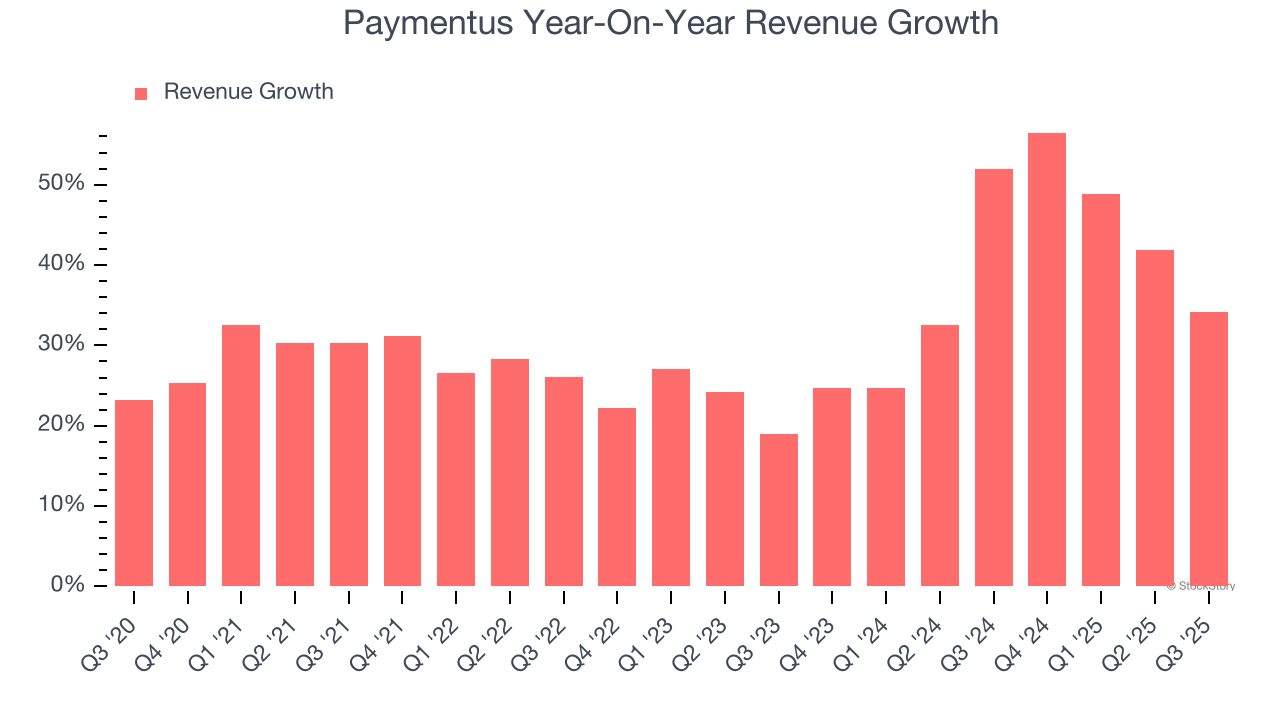
    This quarter, Paymentus reported wonderful year-on-year revenue growth of 34.2%, and its $310.7 million of revenue exceeded Wall Street’s estimates by 10.7%. Company management is currently guiding for a 20% year-on-year increase in sales next quarter.

    While Wall Street chases Nvidia at all-time highs, an under-the-radar semiconductor supplier is dominating a critical AI component these giants can’t build without. Click here to access our free report one of our favorites growth stories.

    Key Takeaways from Paymentus’s Q3 Results

    We were impressed by how significantly Paymentus blew past analysts’ revenue expectations this quarter. We were also glad its full-year revenue guidance exceeded Wall Street’s estimates. Zooming out, we think this was a solid print. The stock traded up 11.3% to $31.79 immediately following the results.

    Paymentus may have had a good quarter, but does that mean you should invest right now? When making that decision, it’s important to consider its valuation, business qualities, as well as what has happened in the latest quarter. We cover that in our actionable full research report which you can read here, it’s free for active Edge members.

    Recent Quotes

    View More
    Symbol Price Change (%)
    AMZN  229.38
    +3.10 (1.37%)
    AAPL  277.73
    +1.81 (0.66%)
    AMD  202.84
    -12.21 (-5.68%)
    BAC  52.73
    +0.80 (1.55%)
    GOOG  321.04
    +2.57 (0.81%)
    META  633.30
    +20.25 (3.30%)
    MSFT  477.04
    +3.04 (0.64%)
    NVDA  176.57
    -5.98 (-3.27%)
    ORCL  195.18
    -5.10 (-2.54%)
    TSLA  417.16
    -0.62 (-0.15%)
    Stock Quote API & Stock News API supplied by www.cloudquote.io
    Quotes delayed at least 20 minutes.
    By accessing this page, you agree to the Privacy Policy and Terms Of Service.


    IntelligentValue Home
    Close Window

    DISCLAIMER

    All content herein is issued solely for informational purposes and is not to be construed as an offer to sell or the solicitation of an offer to buy, nor should it be interpreted as a recommendation to buy, hold or sell (short or otherwise) any security.  All opinions, analyses, and information included herein are based on sources believed to be reliable, but no representation or warranty of any kind, expressed or implied, is made including but not limited to any representation or warranty concerning accuracy, completeness, correctness, timeliness or appropriateness. We undertake no obligation to update such opinions, analysis or information. You should independently verify all information contained on this website. Some information is based on analysis of past performance or hypothetical performance results, which have inherent limitations. We make no representation that any particular equity or strategy will or is likely to achieve profits or losses similar to those shown. Shareholders, employees, writers, contractors, and affiliates associated with ETFOptimize.com may have ownership positions in the securities that are mentioned. If you are not sure if ETFs, algorithmic investing, or a particular investment is right for you, you are urged to consult with a Registered Investment Advisor (RIA). Neither this website nor anyone associated with producing its content are Registered Investment Advisors, and no attempt is made herein to substitute for personalized, professional investment advice. Neither ETFOptimize.com, Global Alpha Investments, Inc., nor its employees, service providers, associates, or affiliates are responsible for any investment losses you may incur as a result of using the information provided herein. Remember that past investment returns may not be indicative of future returns.

    Copyright © 1998-2017 ETFOptimize.com, a publication of Optimized Investments, Inc. All rights reserved.