
Life sciences company Bio-Techne (NASDAQ: TECH) missed Wall Street’s revenue expectations in Q3 CY2025, with sales falling 1% year on year to $286.6 million. Its non-GAAP profit of $0.42 per share was in line with analysts’ consensus estimates.
Is now the time to buy Bio-Techne? Find out by accessing our full research report, it’s free for active Edge members.
Bio-Techne (TECH) Q3 CY2025 Highlights:
- Revenue: $286.6 million vs analyst estimates of $291.6 million (1% year-on-year decline, 1.7% miss)
- Adjusted EPS: $0.42 vs analyst estimates of $0.42 (in line)
- Adjusted EBITDA: $95.94 million vs analyst estimates of $93.09 million (33.5% margin, 3.1% beat)
- Operating Margin: 16.6%, up from 13.8% in the same quarter last year
- Free Cash Flow Margin: 7.8%, down from 18.9% in the same quarter last year
- Organic Revenue fell 1% year on year vs analyst estimates of 1.3% growth (227.8 basis point miss)
- Market Capitalization: $9.51 billion
"The Bio-Techne team once again executed with focus and agility in a dynamic operating environment," said Kim Kelderman, President and Chief Executive Officer of Bio-Techne.
Company Overview
With a catalog of hundreds of thousands of specialized biological products used in laboratories worldwide, Bio-Techne (NASDAQ: TECH) develops and manufactures specialized reagents, instruments, and services that help researchers study biological processes and enable diagnostic testing and cell therapy development.
Revenue Growth
Examining a company’s long-term performance can provide clues about its quality. Any business can experience short-term success, but top-performing ones enjoy sustained growth for years. Thankfully, Bio-Techne’s 9.9% annualized revenue growth over the last five years was decent. Its growth was slightly above the average healthcare company and shows its offerings resonate with customers.

We at StockStory place the most emphasis on long-term growth, but within healthcare, a half-decade historical view may miss recent innovations or disruptive industry trends. Bio-Techne’s recent performance shows its demand has slowed as its annualized revenue growth of 3.1% over the last two years was below its five-year trend. 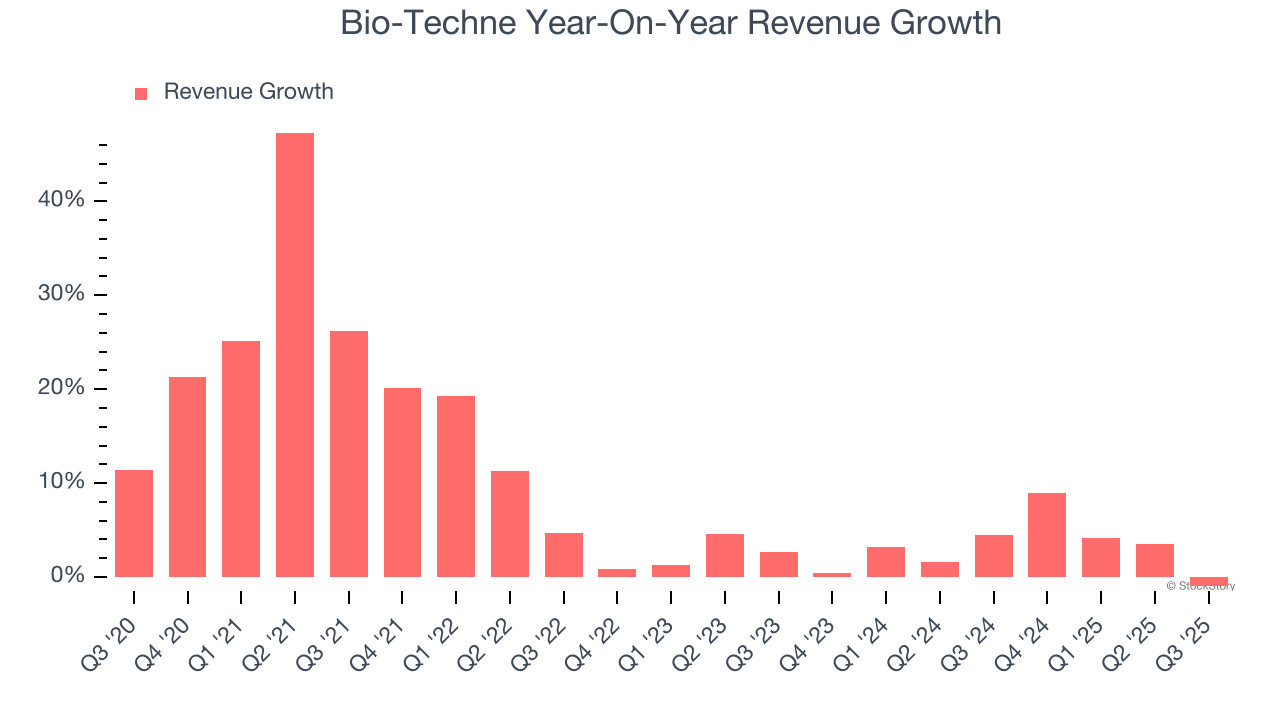
We can better understand the company’s sales dynamics by analyzing its organic revenue, which strips out one-time events like acquisitions and currency fluctuations that don’t accurately reflect its fundamentals. Over the last two years, Bio-Techne’s organic revenue averaged 2.7% year-on-year growth. Because this number aligns with its two-year revenue growth, we can see the company’s core operations (not acquisitions and divestitures) drove most of its results. 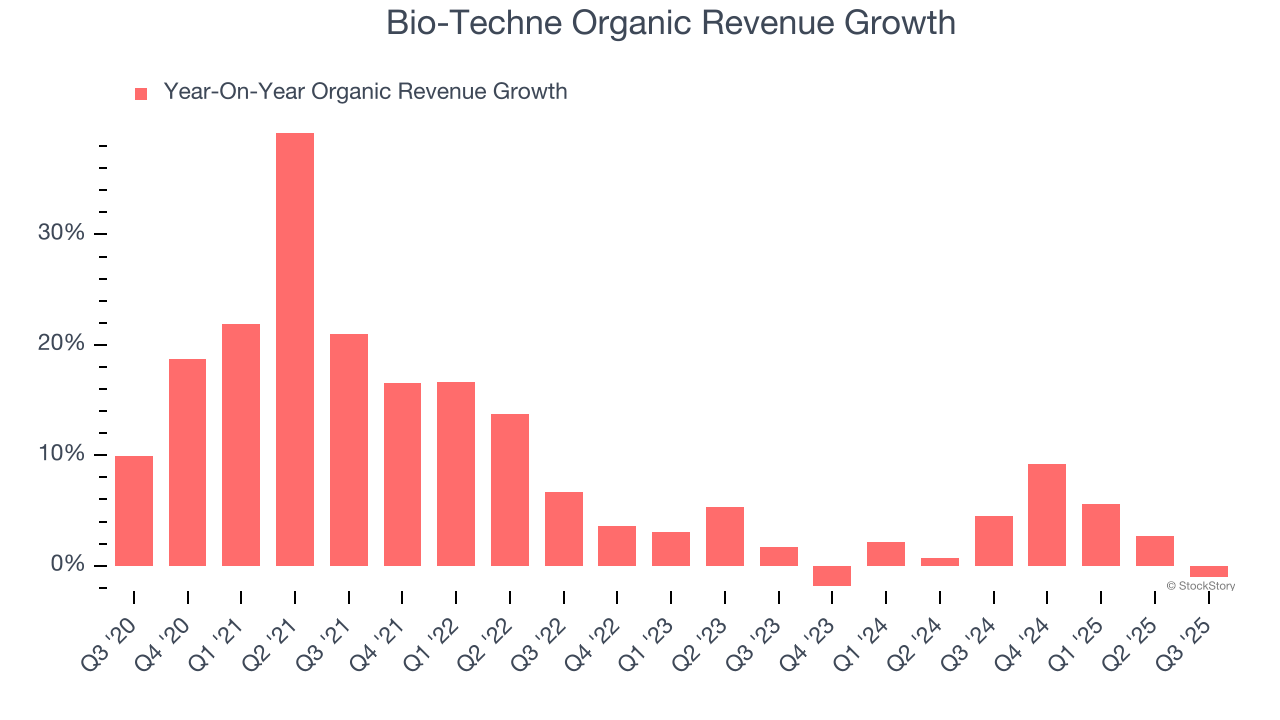
This quarter, Bio-Techne missed Wall Street’s estimates and reported a rather uninspiring 1% year-on-year revenue decline, generating $286.6 million of revenue.
Looking ahead, sell-side analysts expect revenue to grow 3.5% over the next 12 months, similar to its two-year rate. This projection doesn't excite us and implies its newer products and services will not accelerate its top-line performance yet.
While Wall Street chases Nvidia at all-time highs, an under-the-radar semiconductor supplier is dominating a critical AI component these giants can’t build without. Click here to access our free report one of our favorites growth stories.
Operating Margin
Operating margin is one of the best measures of profitability because it tells us how much money a company takes home after subtracting all core expenses, like marketing and R&D.
Bio-Techne has been an efficient company over the last five years. It was one of the more profitable businesses in the healthcare sector, boasting an average operating margin of 20.2%.
Analyzing the trend in its profitability, Bio-Techne’s operating margin decreased by 16.5 percentage points over the last five years. The company’s two-year trajectory also shows it failed to get its profitability back to the peak as its margin fell by 17.1 percentage points. This performance was poor no matter how you look at it - it shows its expenses were rising and it couldn’t pass those costs onto its customers.
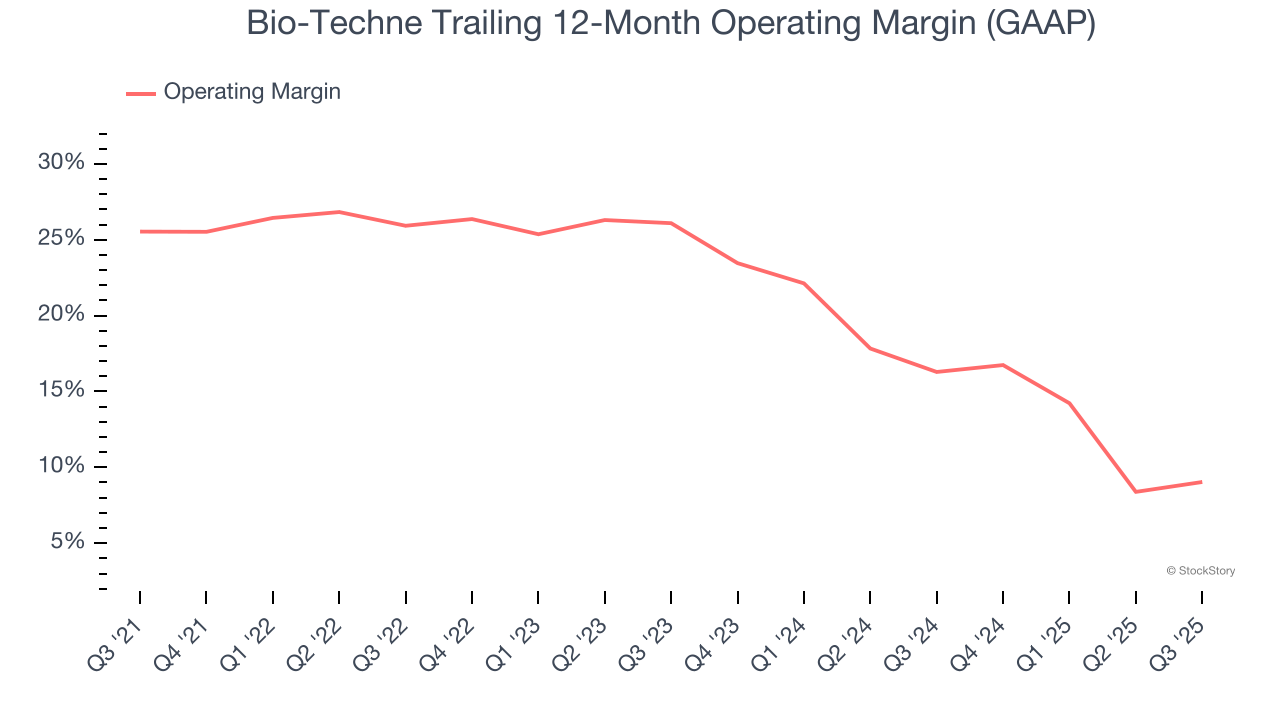
In Q3, Bio-Techne generated an operating margin profit margin of 16.6%, up 2.8 percentage points year on year. This increase was a welcome development, especially since its revenue fell, showing it was more efficient because it scaled down its expenses.
Earnings Per Share
We track the long-term change in earnings per share (EPS) for the same reason as long-term revenue growth. Compared to revenue, however, EPS highlights whether a company’s growth is profitable.
Bio-Techne’s remarkable 9.5% annual EPS growth over the last five years aligns with its revenue performance. This tells us it maintained its per-share profitability as it expanded.
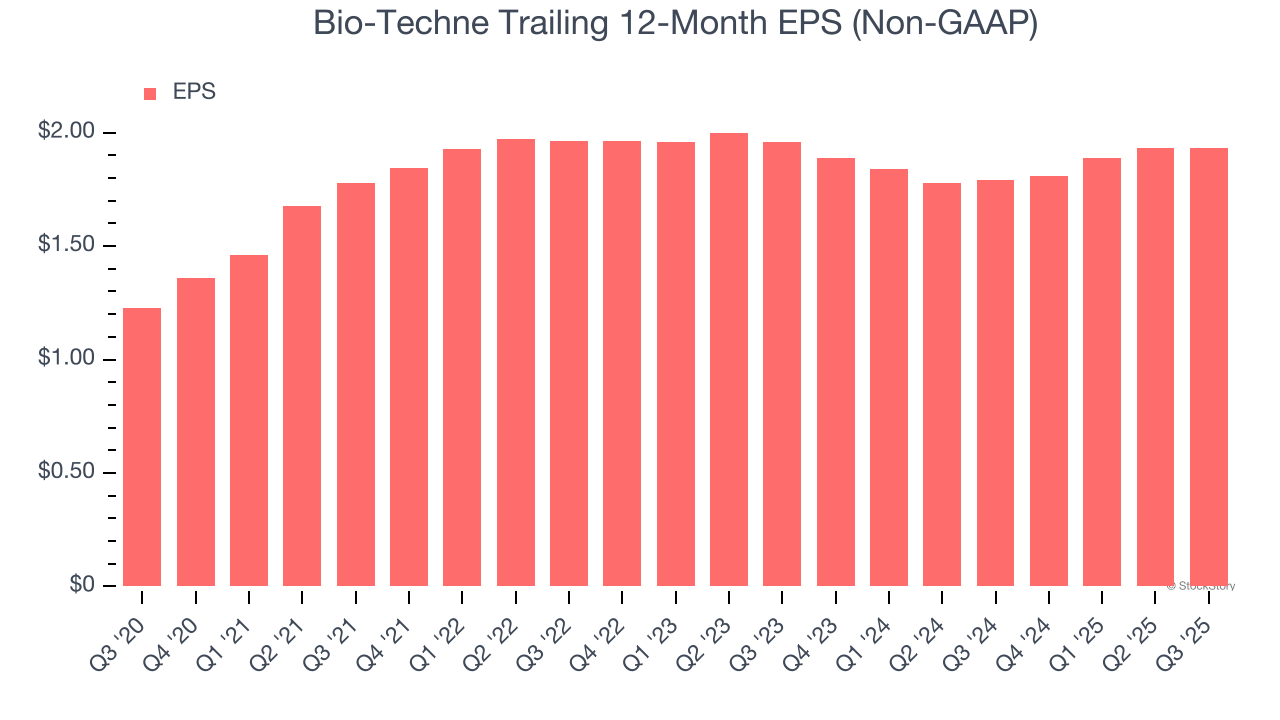
In Q3, Bio-Techne reported adjusted EPS of $0.42, in line with the same quarter last year. This print was close to analysts’ estimates. Over the next 12 months, Wall Street expects Bio-Techne’s full-year EPS of $1.93 to grow 6.6%.
Key Takeaways from Bio-Techne’s Q3 Results
We struggled to find many positives in these results. Its revenue missed and its organic revenue fell short of Wall Street’s estimates. Overall, this was a softer quarter. The stock traded down 5.9% to $57.50 immediately after reporting.
The latest quarter from Bio-Techne’s wasn’t that good. One earnings report doesn’t define a company’s quality, though, so let’s explore whether the stock is a buy at the current price. What happened in the latest quarter matters, but not as much as longer-term business quality and valuation, when deciding whether to invest in this stock. We cover that in our actionable full research report which you can read here, it’s free for active Edge members.


