
Refrigerant services company Hudson Technologies (NASDAQ: HDSN) reported Q3 CY2025 results topping the market’s revenue expectations, with sales up 19.5% year on year to $74.01 million. Its GAAP profit of $0.27 per share was 40.3% above analysts’ consensus estimates.
Is now the time to buy Hudson Technologies? Find out by accessing our full research report, it’s free for active Edge members.
Hudson Technologies (HDSN) Q3 CY2025 Highlights:
- Revenue: $74.01 million vs analyst estimates of $72.15 million (19.5% year-on-year growth, 2.6% beat)
- EPS (GAAP): $0.27 vs analyst estimates of $0.19 (40.3% beat)
- Operating Margin: 18.9%, up from 11.3% in the same quarter last year
- Free Cash Flow Margin: 9.1%, down from 46.2% in the same quarter last year
- Market Capitalization: $370.7 million
Company Overview
Founded in 1991, Hudson Technologies (NASDAQ: HDSN) specializes in refrigerant services and solutions, providing refrigerant sales, reclamation, and recycling.
Revenue Growth
A company’s long-term sales performance is one signal of its overall quality. Any business can experience short-term success, but top-performing ones enjoy sustained growth for years. Thankfully, Hudson Technologies’s 9.4% annualized revenue growth over the last five years was solid. Its growth beat the average industrials company and shows its offerings resonate with customers.
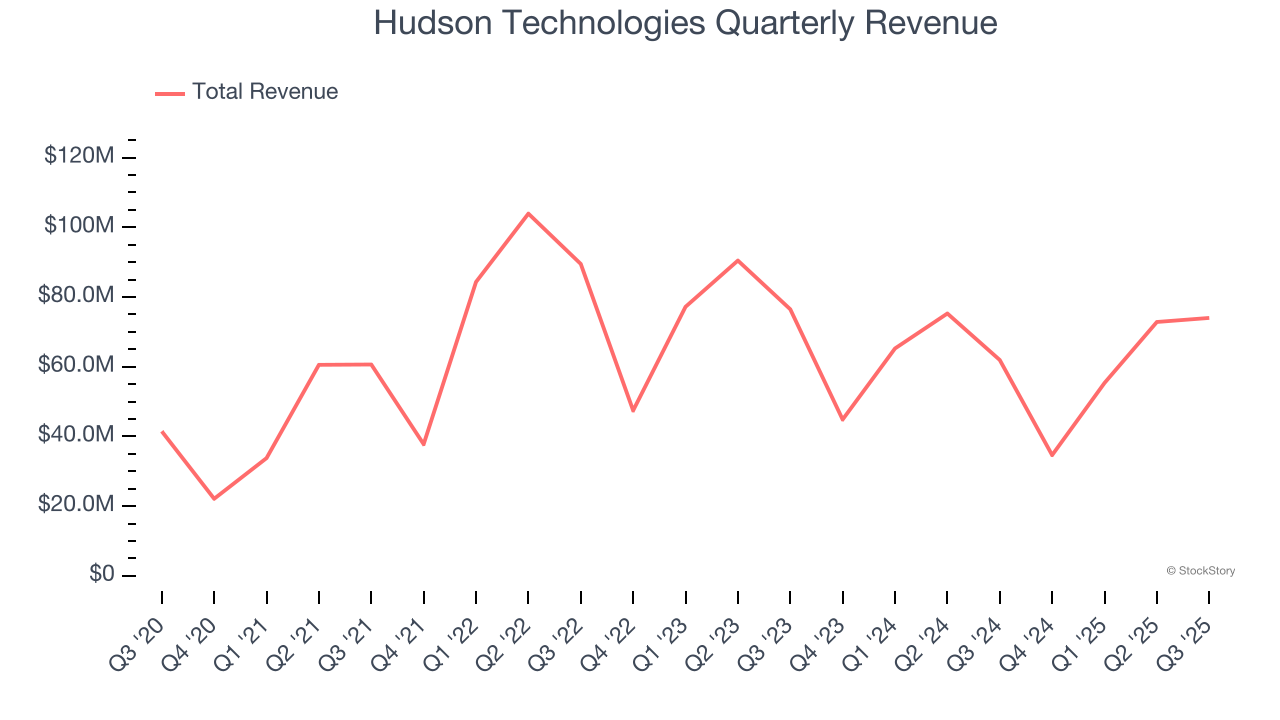
We at StockStory place the most emphasis on long-term growth, but within industrials, a half-decade historical view may miss cycles, industry trends, or a company capitalizing on catalysts such as a new contract win or a successful product line. Hudson Technologies’s recent performance marks a sharp pivot from its five-year trend as its revenue has shown annualized declines of 9.9% over the last two years. 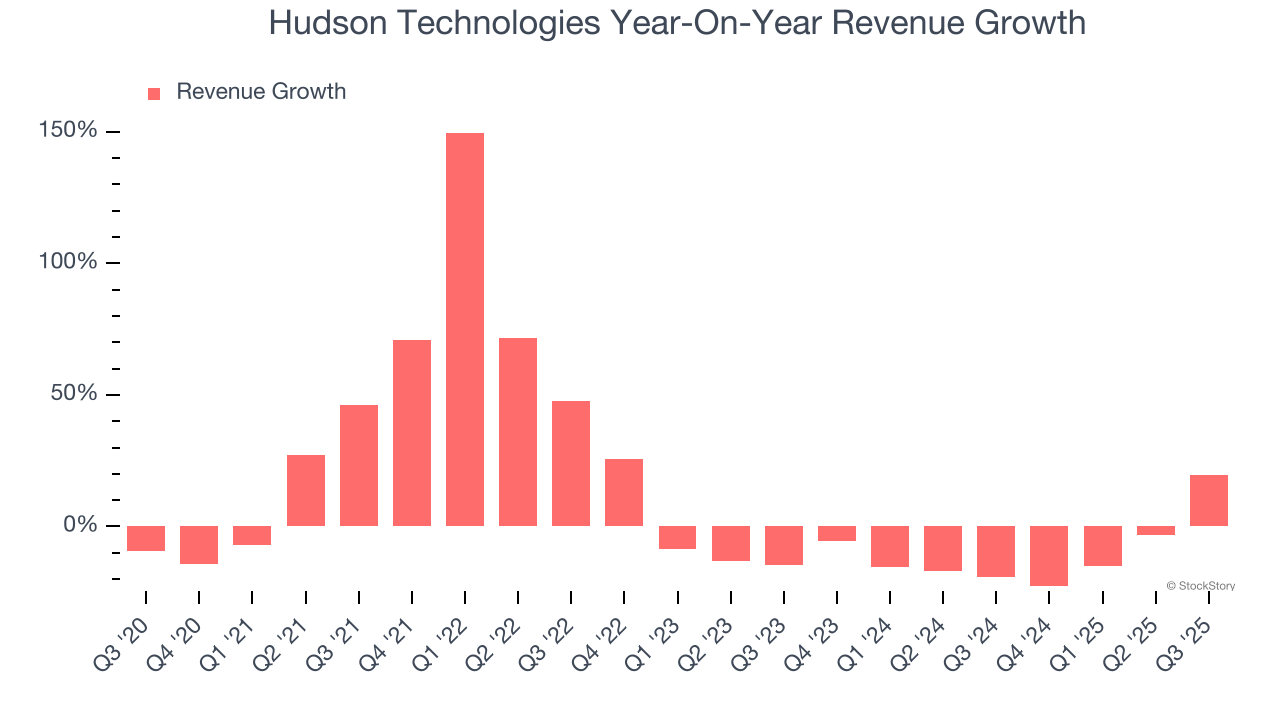
This quarter, Hudson Technologies reported year-on-year revenue growth of 19.5%, and its $74.01 million of revenue exceeded Wall Street’s estimates by 2.6%.
Looking ahead, sell-side analysts expect revenue to grow 12% over the next 12 months, an improvement versus the last two years. This projection is admirable and suggests its newer products and services will catalyze better top-line performance.
While Wall Street chases Nvidia at all-time highs, an under-the-radar semiconductor supplier is dominating a critical AI component these giants can’t build without. Click here to access our free report one of our favorites growth stories.
Operating Margin
Hudson Technologies has been a well-oiled machine over the last five years. It demonstrated elite profitability for an industrials business, boasting an average operating margin of 24.4%. This result isn’t surprising as its high gross margin gives it a favorable starting point.
Looking at the trend in its profitability, Hudson Technologies’s operating margin decreased by 6.3 percentage points over the last five years. This raises questions about the company’s expense base because its revenue growth should have given it leverage on its fixed costs, resulting in better economies of scale and profitability.
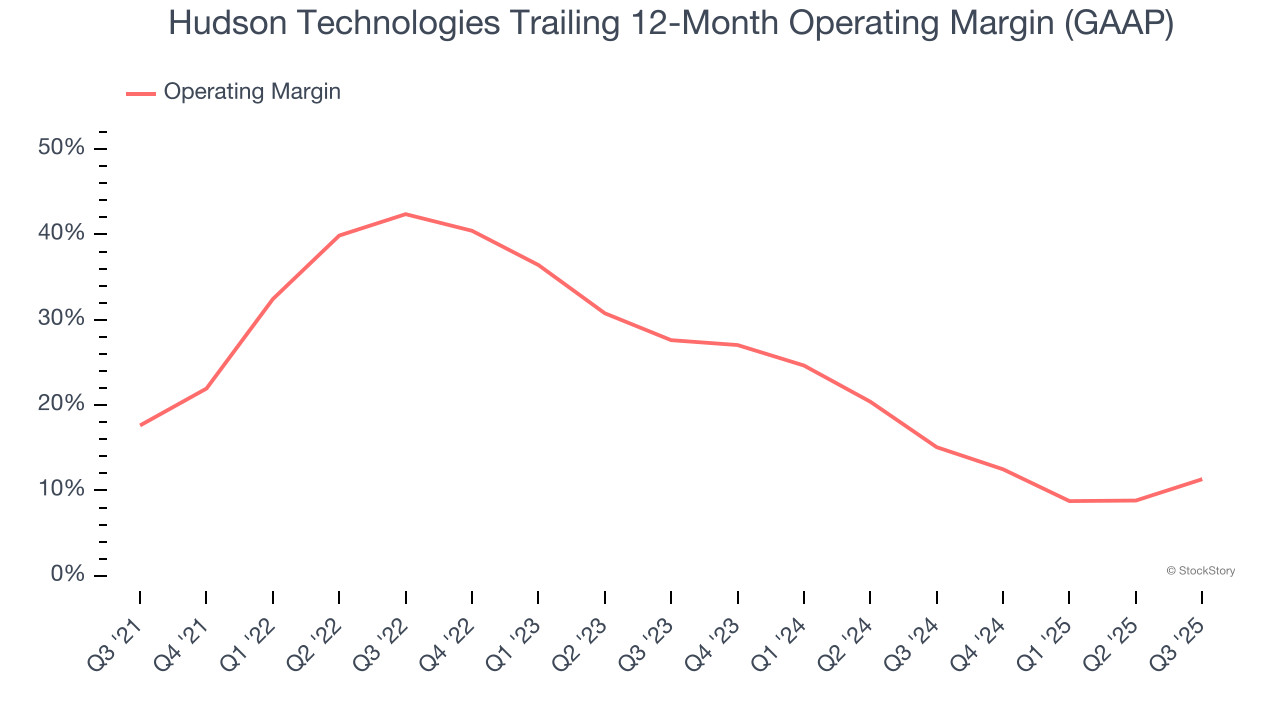
In Q3, Hudson Technologies generated an operating margin profit margin of 18.9%, up 7.6 percentage points year on year. The increase was solid, and because its operating margin rose more than its gross margin, we can infer it was more efficient with expenses such as marketing, R&D, and administrative overhead.
Earnings Per Share
We track the long-term change in earnings per share (EPS) for the same reason as long-term revenue growth. Compared to revenue, however, EPS highlights whether a company’s growth is profitable.
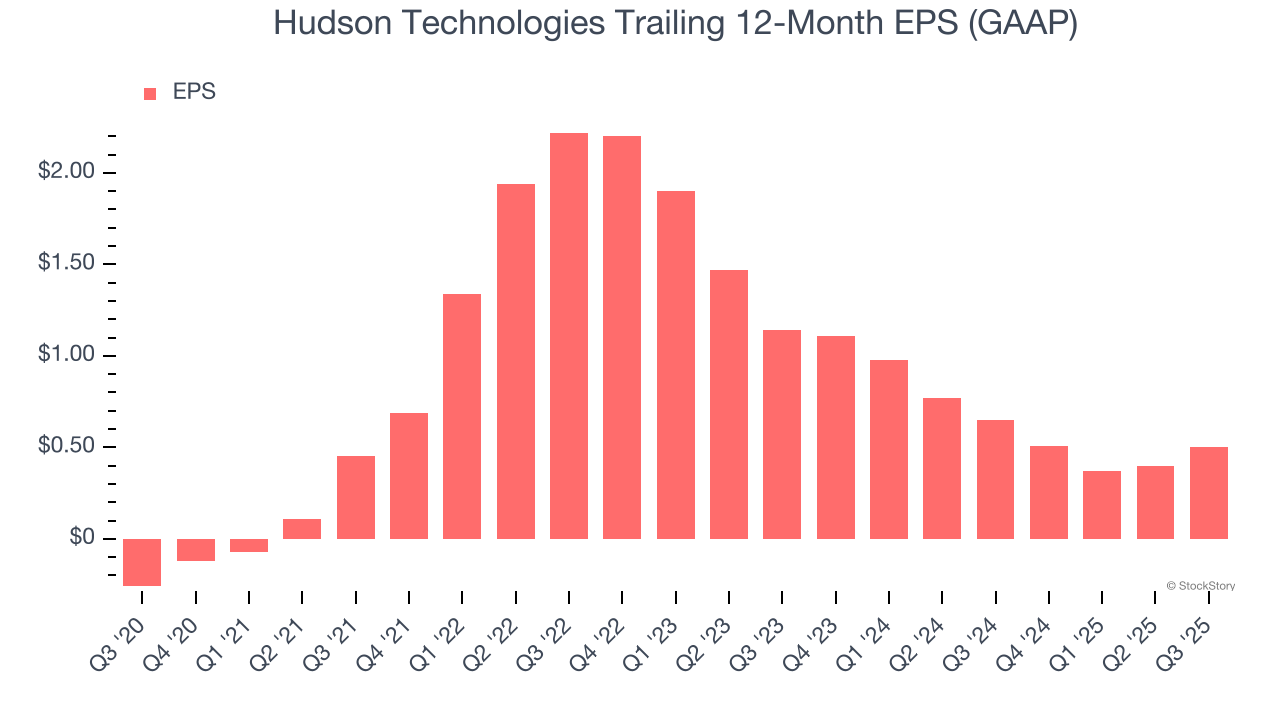
Hudson Technologies’s full-year EPS flipped from negative to positive over the last five years. This is encouraging and shows it’s at a critical moment in its life.
Like with revenue, we analyze EPS over a more recent period because it can provide insight into an emerging theme or development for the business.
Sadly for Hudson Technologies, its EPS declined by more than its revenue over the last two years, dropping 33.8%. This tells us the company struggled to adjust to shrinking demand.
We can take a deeper look into Hudson Technologies’s earnings to better understand the drivers of its performance. While we mentioned earlier that Hudson Technologies’s operating margin expanded this quarter, a two-year view shows its margin has declined. This was the most relevant factor (aside from the revenue impact) behind its lower earnings; interest expenses and taxes can also affect EPS but don’t tell us as much about a company’s fundamentals.
In Q3, Hudson Technologies reported EPS of $0.27, up from $0.17 in the same quarter last year. This print easily cleared analysts’ estimates, and shareholders should be content with the results. Over the next 12 months, Wall Street expects Hudson Technologies’s full-year EPS of $0.50 to grow 21%.
Key Takeaways from Hudson Technologies’s Q3 Results
It was good to see Hudson Technologies beat analysts’ EPS expectations this quarter. We were also glad its revenue outperformed Wall Street’s estimates. Zooming out, we think this quarter featured some important positives. The stock remained flat at $8.63 immediately following the results.
Hudson Technologies may have had a good quarter, but does that mean you should invest right now? The latest quarter does matter, but not nearly as much as longer-term fundamentals and valuation, when deciding if the stock is a buy. We cover that in our actionable full research report which you can read here, it’s free for active Edge members.


