
Moving and storage solutions provider U-Haul (NYSE: UHAL) met Wall Streets revenue expectations in Q3 CY2025, with sales up 3.7% year on year to $1.72 billion. Its GAAP profit of $0.49 per share was 24.6% below analysts’ consensus estimates.
Is now the time to buy U-Haul? Find out by accessing our full research report, it’s free for active Edge members.
U-Haul (UHAL) Q3 CY2025 Highlights:
- Revenue: $1.72 billion vs analyst estimates of $1.73 billion (3.7% year-on-year growth, in line)
- EPS (GAAP): $0.49 vs analyst expectations of $0.65 (24.6% miss)
- Operating Margin: 12.7%, down from 18.4% in the same quarter last year
- Market Capitalization: $9.65 billion
Company Overview
Founded by a husband and wife duo, U-Haul (NYSE: UHAL) is a provider of rental trucks and storage facilities.
Revenue Growth
A company’s long-term performance is an indicator of its overall quality. Any business can put up a good quarter or two, but many enduring ones grow for years. Luckily, U-Haul’s sales grew at a decent 8% compounded annual growth rate over the last five years. Its growth was slightly above the average industrials company and shows its offerings resonate with customers.
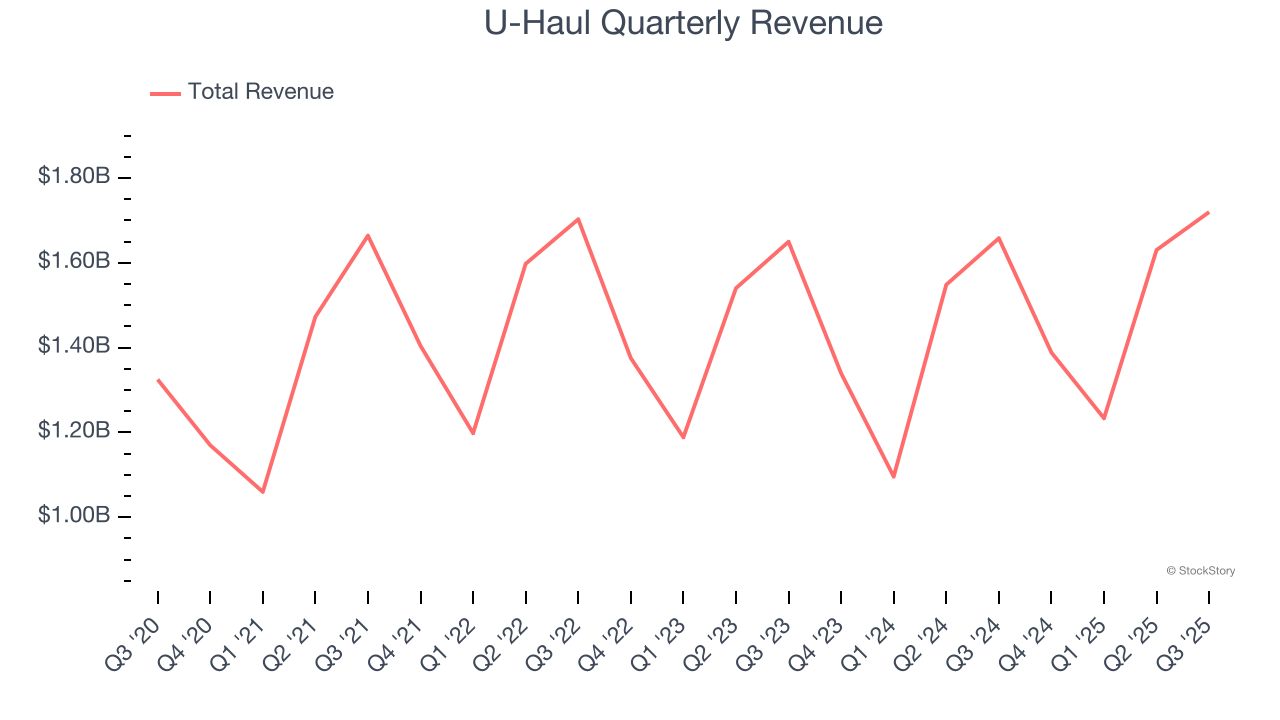
Long-term growth is the most important, but within industrials, a half-decade historical view may miss new industry trends or demand cycles. U-Haul’s recent performance shows its demand has slowed as its annualized revenue growth of 1.9% over the last two years was below its five-year trend. We also note many other Ground Transportation businesses have faced declining sales because of cyclical headwinds. While U-Haul grew slower than we’d like, it did do better than its peers. 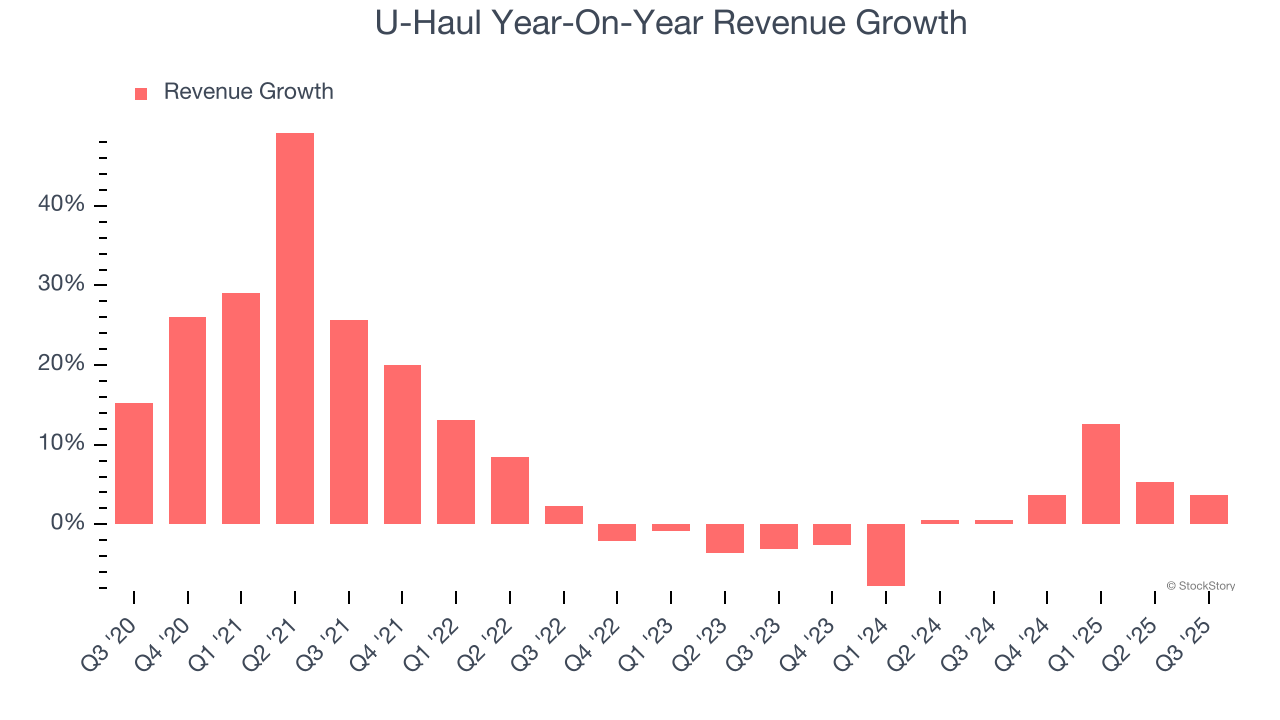
This quarter, U-Haul grew its revenue by 3.7% year on year, and its $1.72 billion of revenue was in line with Wall Street’s estimates.
Looking ahead, sell-side analysts expect revenue to grow 2.2% over the next 12 months, similar to its two-year rate. This projection doesn't excite us and suggests its newer products and services will not lead to better top-line performance yet.
Software is eating the world and there is virtually no industry left that has been untouched by it. That drives increasing demand for tools helping software developers do their jobs, whether it be monitoring critical cloud infrastructure, integrating audio and video functionality, or ensuring smooth content streaming. Click here to access a free report on our 3 favorite stocks to play this generational megatrend.
Operating Margin
U-Haul has been a well-oiled machine over the last five years. It demonstrated elite profitability for an industrials business, boasting an average operating margin of 19.9%.
Looking at the trend in its profitability, U-Haul’s operating margin decreased by 17.8 percentage points over the last five years. Many Ground Transportation companies also saw their margins fall (along with revenue, as mentioned above) because the cycle turned in the wrong direction. We hope U-Haul can emerge from this a stronger company, as the silver lining of a downturn is that market share can be won and efficiencies found.
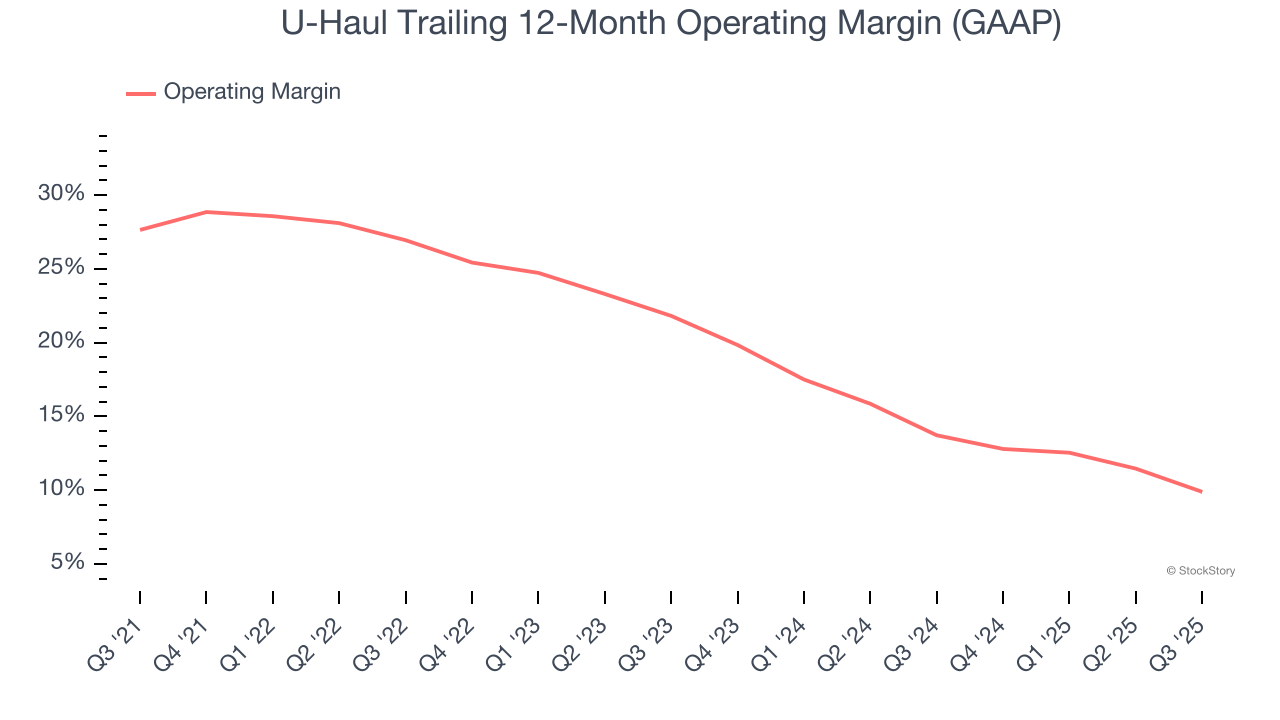
In Q3, U-Haul generated an operating margin profit margin of 12.7%, down 5.7 percentage points year on year. Conversely, its revenue and gross margin actually rose, so we can assume it was less efficient because its operating expenses like marketing, R&D, and administrative overhead grew faster than its revenue.
Earnings Per Share
We track the long-term change in earnings per share (EPS) for the same reason as long-term revenue growth. Compared to revenue, however, EPS highlights whether a company’s growth is profitable.
Sadly for U-Haul, its EPS declined by 17.1% annually over the last five years while its revenue grew by 8%. This tells us the company became less profitable on a per-share basis as it expanded due to non-fundamental factors such as interest expenses and taxes.
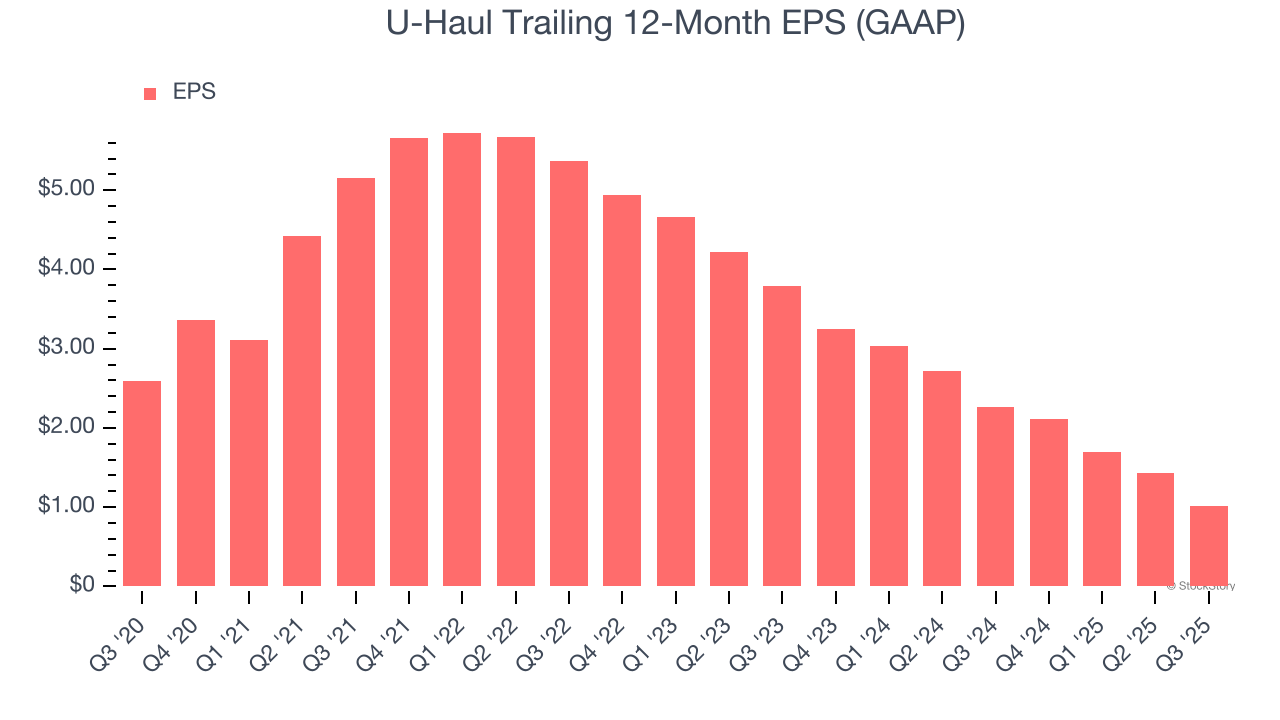
We can take a deeper look into U-Haul’s earnings to better understand the drivers of its performance. As we mentioned earlier, U-Haul’s operating margin declined by 17.8 percentage points over the last five years. This was the most relevant factor (aside from the revenue impact) behind its lower earnings; interest expenses and taxes can also affect EPS but don’t tell us as much about a company’s fundamentals.
Like with revenue, we analyze EPS over a more recent period because it can provide insight into an emerging theme or development for the business.
For U-Haul, its two-year annual EPS declines of 48.4% show it’s continued to underperform. These results were bad no matter how you slice the data.
In Q3, U-Haul reported EPS of $0.49, down from $0.91 in the same quarter last year. This print missed analysts’ estimates. We also like to analyze expected EPS growth based on Wall Street analysts’ consensus projections, but there is insufficient data.
Key Takeaways from U-Haul’s Q3 Results
We struggled to find many positives in these results. Its EPS missed and its revenue was in line with Wall Street’s estimates. Overall, this was a weaker quarter. The stock traded down 1.8% to $52.47 immediately after reporting.
U-Haul may have had a tough quarter, but does that actually create an opportunity to invest right now? What happened in the latest quarter matters, but not as much as longer-term business quality and valuation, when deciding whether to invest in this stock. We cover that in our actionable full research report which you can read here, it’s free for active Edge members.


