
Pop culture collectibles manufacturer Funko (NASDAQ: FNKO) fell short of the markets revenue expectations in Q3 CY2025, with sales falling 14.3% year on year to $250.9 million. Its non-GAAP profit of $0.06 per share was significantly above analysts’ consensus estimates.
Is now the time to buy Funko? Find out by accessing our full research report, it’s free for active Edge members.
Funko (FNKO) Q3 CY2025 Highlights:
- Revenue: $250.9 million vs analyst estimates of $262 million (14.3% year-on-year decline, 4.2% miss)
- Adjusted EPS: $0.06 vs analyst estimates of -$0.09 (significant beat)
- Adjusted EBITDA: $24.43 million vs analyst estimates of $15 million (9.7% margin, 62.9% beat)
- Operating Margin: 2.6%, down from 4% in the same quarter last year
- Free Cash Flow was $3.38 million, up from -$4.08 million in the same quarter last year
- Market Capitalization: $217.6 million
"We delivered a solid 2025 third quarter performance, with net sales in line with internal expectations and gross margin and bottom-line profitability well ahead of expectations,” said Josh Simon, Chief Executive Officer of Funko.
Company Overview
Boasting partnerships with media franchises like Marvel and One Piece, Funko (NASDAQ: FNKO) is a company specializing in creating and distributing licensed pop culture collectibles.
Revenue Growth
Examining a company’s long-term performance can provide clues about its quality. Even a bad business can shine for one or two quarters, but a top-tier one grows for years. Unfortunately, Funko’s 7.7% annualized revenue growth over the last five years was sluggish. This was below our standard for the consumer discretionary sector and is a rough starting point for our analysis.
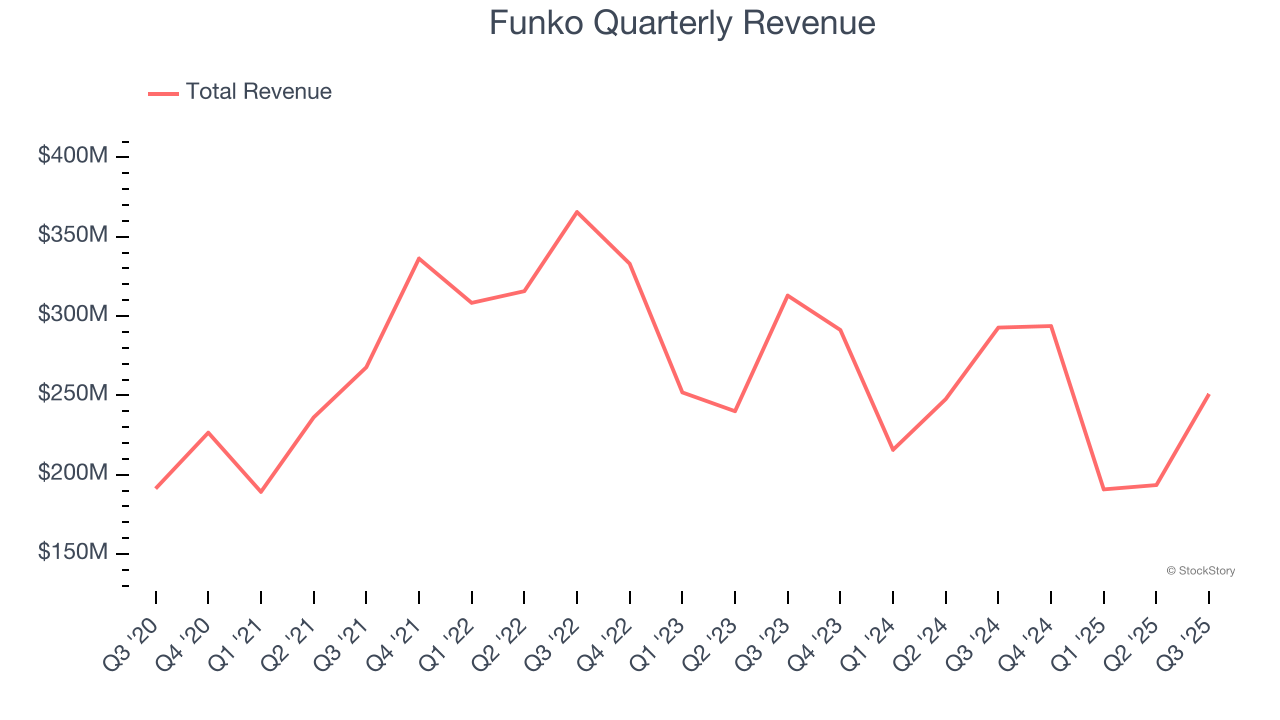
Long-term growth is the most important, but within consumer discretionary, product cycles are short and revenue can be hit-driven due to rapidly changing trends and consumer preferences. Funko’s performance shows it grew in the past but relinquished its gains over the last two years, as its revenue fell by 9.7% annually. 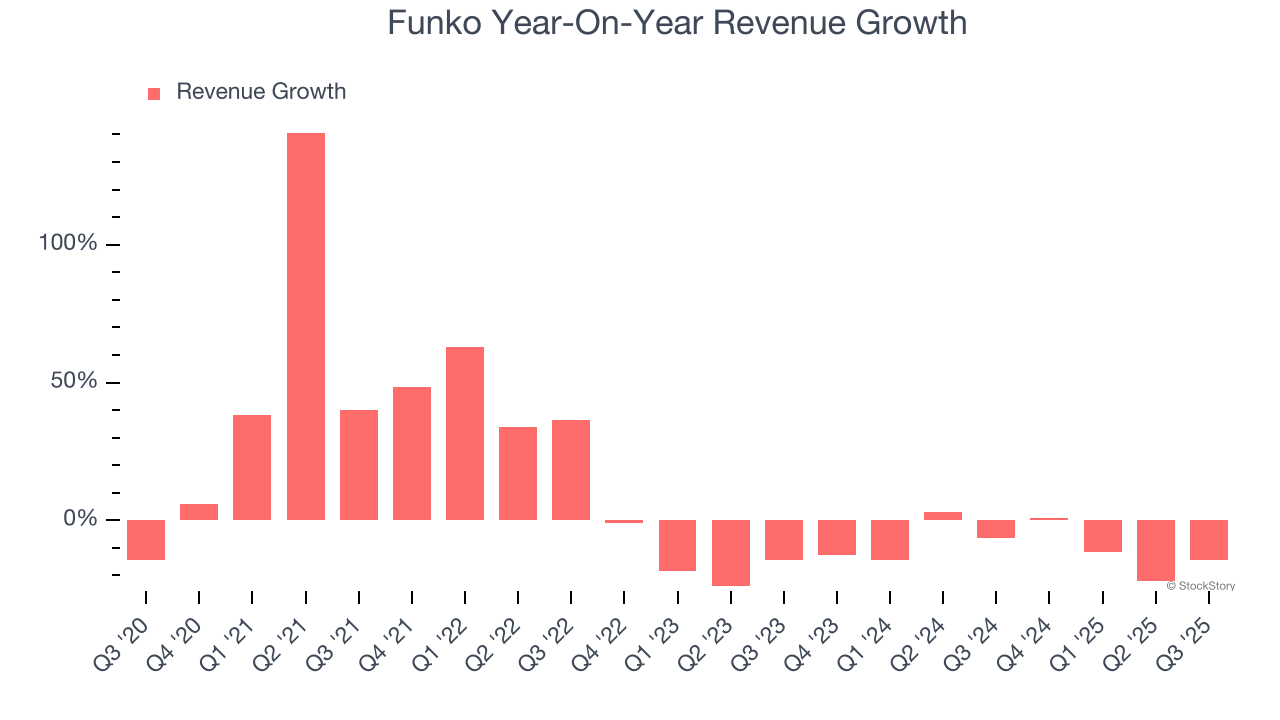
This quarter, Funko missed Wall Street’s estimates and reported a rather uninspiring 14.3% year-on-year revenue decline, generating $250.9 million of revenue.
Looking ahead, sell-side analysts expect revenue to grow 7.4% over the next 12 months. While this projection indicates its newer products and services will fuel better top-line performance, it is still below average for the sector.
Microsoft, Alphabet, Coca-Cola, Monster Beverage—all began as under-the-radar growth stories riding a massive trend. We’ve identified the next one: a profitable AI semiconductor play Wall Street is still overlooking. Go here for access to our full report.
Operating Margin
Funko’s operating margin has shrunk over the last 12 months and averaged negative 2.1% over the last two years. Unprofitable consumer discretionary companies with falling margins deserve extra scrutiny because they’re spending loads of money to stay relevant, an unsustainable practice.
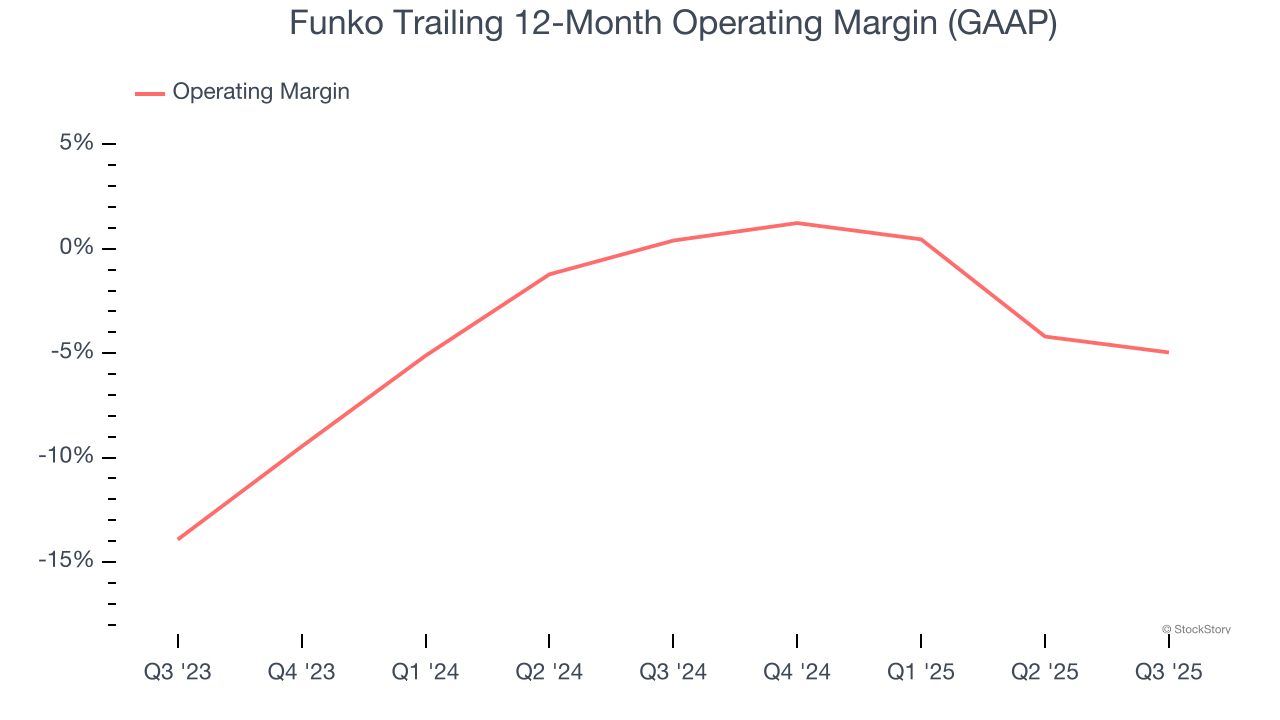
This quarter, Funko generated an operating margin profit margin of 2.6%, down 1.4 percentage points year on year. This reduction is quite minuscule and indicates the company’s overall cost structure has been relatively stable.
Earnings Per Share
We track the long-term change in earnings per share (EPS) for the same reason as long-term revenue growth. Compared to revenue, however, EPS highlights whether a company’s growth is profitable.
Sadly for Funko, its EPS declined by 36.2% annually over the last five years while its revenue grew by 7.7%. This tells us the company became less profitable on a per-share basis as it expanded.
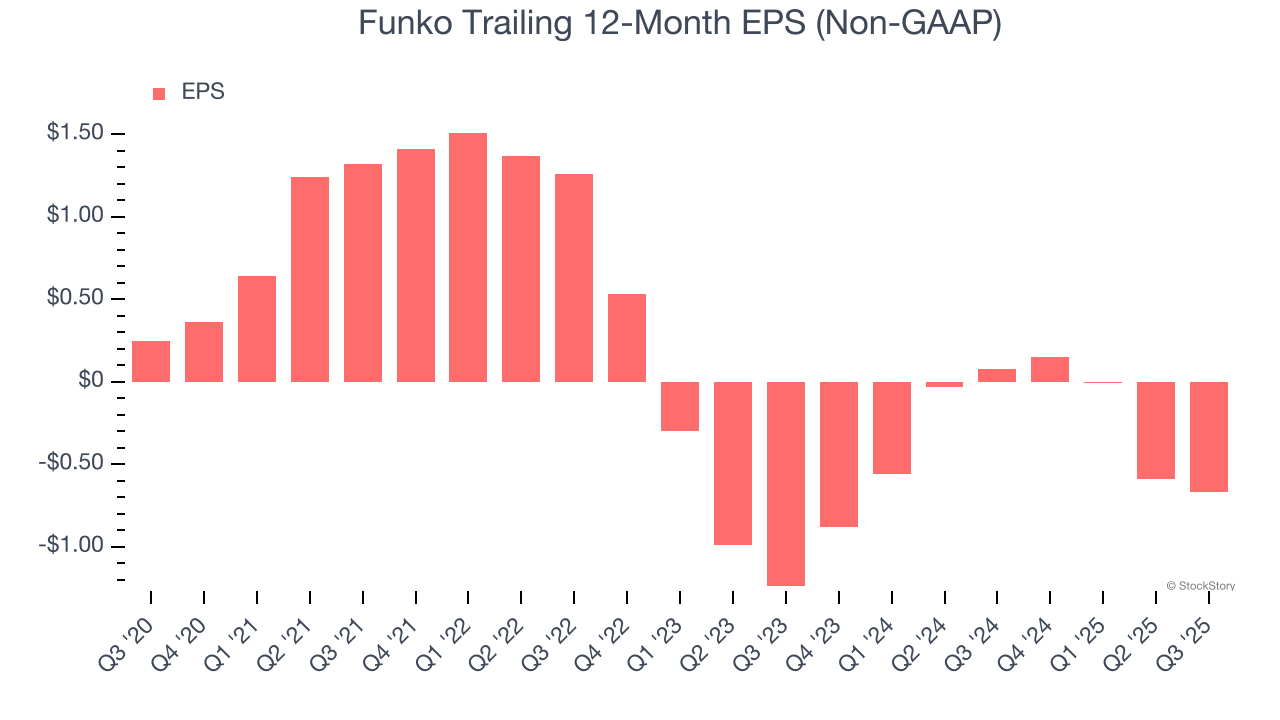
In Q3, Funko reported adjusted EPS of $0.06, down from $0.14 in the same quarter last year. Despite falling year on year, this print easily cleared analysts’ estimates. Over the next 12 months, Wall Street expects Funko to improve its earnings losses. Analysts forecast its full-year EPS of negative $0.67 will advance to negative $0.12.
Key Takeaways from Funko’s Q3 Results
It was good to see Funko beat analysts’ EPS expectations this quarter. We were also excited its EBITDA outperformed Wall Street’s estimates by a wide margin. On the other hand, its revenue missed. Overall, we think this was a solid quarter with some key areas of upside. The stock traded up 15.9% to $3.50 immediately after reporting.
Funko may have had a good quarter, but does that mean you should invest right now? We think that the latest quarter is only one piece of the longer-term business quality puzzle. Quality, when combined with valuation, can help determine if the stock is a buy. We cover that in our actionable full research report which you can read here, it’s free for active Edge members.


