
OLED provider Universal Display (NASDAQ: OLED) fell short of the markets revenue expectations in Q3 CY2025, with sales falling 13.6% year on year to $139.6 million. On the other hand, the company’s outlook for the full year was close to analysts’ estimates with revenue guided to $675 million at the midpoint. Its GAAP profit of $0.92 per share was 21.6% below analysts’ consensus estimates.
Is now the time to buy Universal Display? Find out by accessing our full research report, it’s free for active Edge members.
Universal Display (OLED) Q3 CY2025 Highlights:
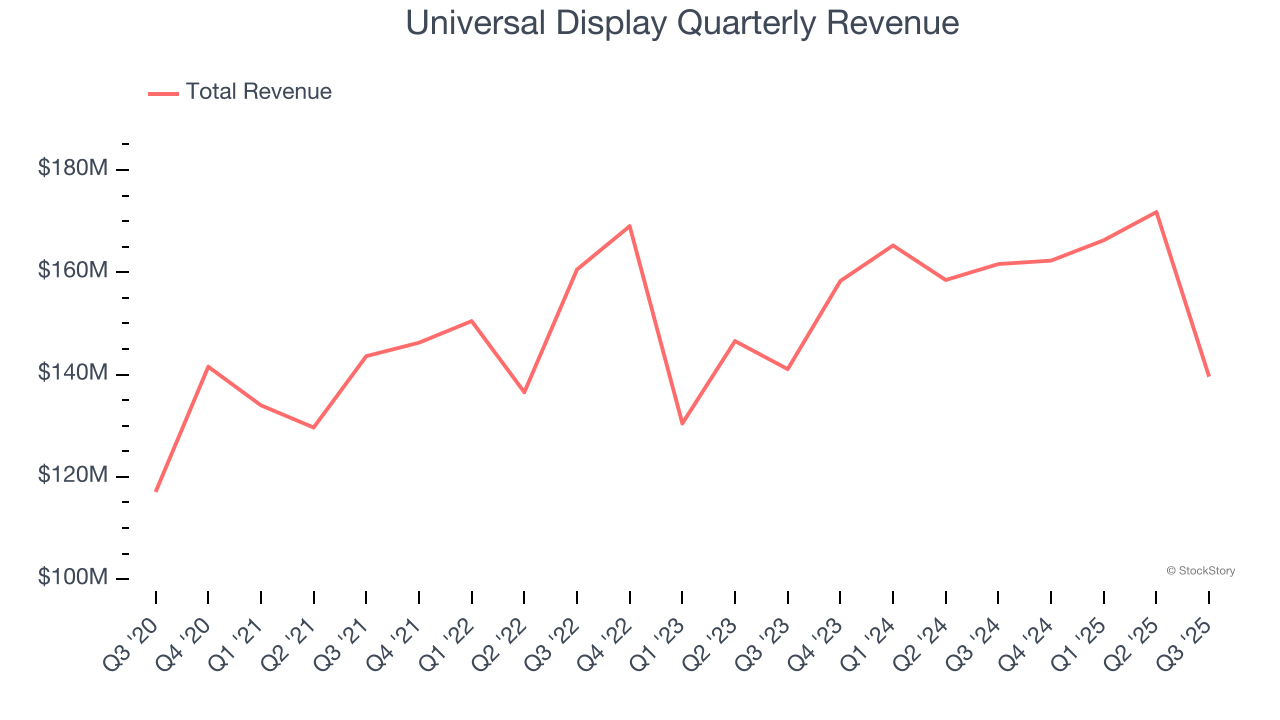
- Revenue: $139.6 million vs analyst estimates of $166.1 million (13.6% year-on-year decline, 15.9% miss)
- EPS (GAAP): $0.92 vs analyst expectations of $1.17 (21.6% miss)
- The company reconfirmed its revenue guidance for the full year of $675 million at the midpoint
- Operating Margin: 30.9%, down from 41.5% in the same quarter last year
- Free Cash Flow Margin: 60.4%, up from 41% in the same quarter last year
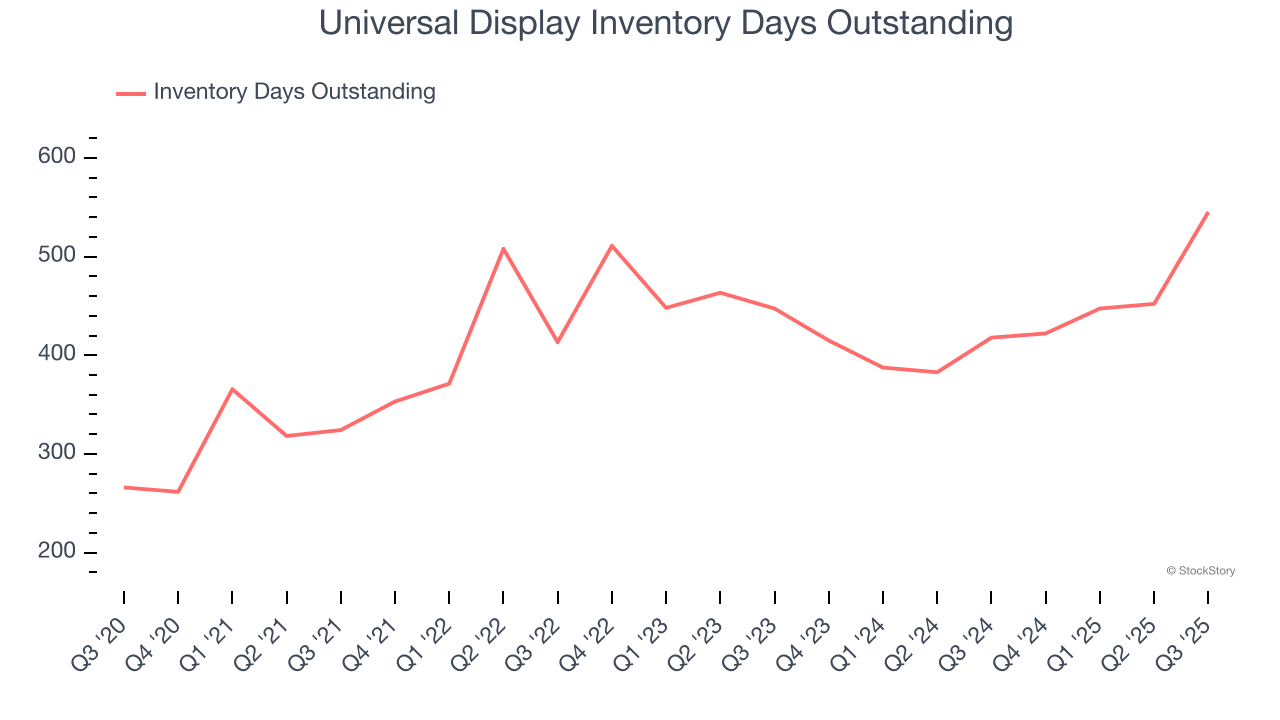
- Inventory Days Outstanding: 545, up from 452 in the previous quarter
- Market Capitalization: $6.98 billion
Company Overview
Serving major consumer electronics manufacturers, Universal Display (NASDAQ: OLED) is a provider of organic light emitting diode (OLED) technologies used in display and lighting applications.
Revenue Growth
A company’s long-term sales performance can indicate its overall quality. Any business can put up a good quarter or two, but many enduring ones grow for years. Luckily, Universal Display’s sales grew at a solid 10.5% compounded annual growth rate over the last five years. Its growth beat the average semiconductor company and shows its offerings resonate with customers, a helpful starting point for our analysis. Semiconductors are a cyclical industry, and long-term investors should be prepared for periods of high growth followed by periods of revenue contractions.
We at StockStory place the most emphasis on long-term growth, but within semiconductors, a half-decade historical view may miss new demand cycles or industry trends like AI. Universal Display’s annualized revenue growth of 4.4% over the last two years is below its five-year trend, but we still think the results were respectable. 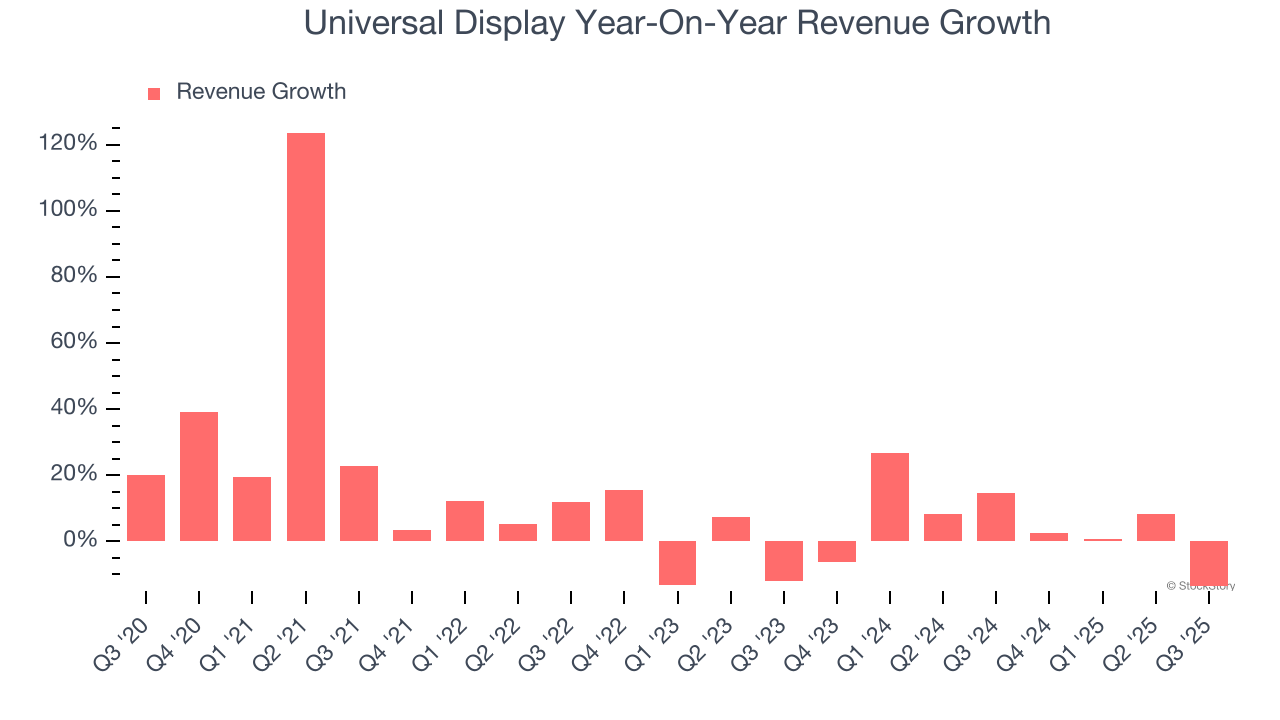
This quarter, Universal Display missed Wall Street’s estimates and reported a rather uninspiring 13.6% year-on-year revenue decline, generating $139.6 million of revenue.
Looking ahead, sell-side analysts expect revenue to grow 12.1% over the next 12 months, an improvement versus the last two years. This projection is above the sector average and indicates its newer products and services will spur better top-line performance.
While Wall Street chases Nvidia at all-time highs, an under-the-radar semiconductor supplier is dominating a critical AI component these giants can’t build without. Click here to access our free report one of our favorites growth stories.
Product Demand & Outstanding Inventory
Days Inventory Outstanding (DIO) is an important metric for chipmakers, as it reflects a business’ capital intensity and the cyclical nature of semiconductor supply and demand. In a tight supply environment, inventories tend to be stable, allowing chipmakers to exert pricing power. Steadily increasing DIO can be a warning sign that demand is weak, and if inventories continue to rise, the company may have to downsize production.
This quarter, Universal Display’s DIO came in at 545, which is 132 days above its five-year average, suggesting that the company’s inventory has grown to higher levels than we’ve seen in the past.
Key Takeaways from Universal Display’s Q3 Results
We struggled to find many positives in these results. Its revenue missed and its EPS fell short of Wall Street’s estimates. Overall, this was a softer quarter. The stock traded down 14.4% to $115.83 immediately following the results.
The latest quarter from Universal Display’s wasn’t that good. One earnings report doesn’t define a company’s quality, though, so let’s explore whether the stock is a buy at the current price. What happened in the latest quarter matters, but not as much as longer-term business quality and valuation, when deciding whether to invest in this stock. We cover that in our actionable full research report which you can read here, it’s free for active Edge members.


