
Luxury hotels and casino operator Wynn Resorts (NASDAQ: WYNN) beat Wall Street’s revenue expectations in Q3 CY2025, with sales up 8.3% year on year to $1.83 billion. Its non-GAAP profit of $0.86 per share was 25.4% below analysts’ consensus estimates.
Is now the time to buy Wynn Resorts? Find out by accessing our full research report, it’s free for active Edge members.
Wynn Resorts (WYNN) Q3 CY2025 Highlights:
- Revenue: $1.83 billion vs analyst estimates of $1.77 billion (8.3% year-on-year growth, 3.4% beat)
- Adjusted EPS: $0.86 vs analyst expectations of $1.15 (25.4% miss)
- Adjusted EBITDA: $486 million vs analyst estimates of $540.4 million (26.5% margin, 10.1% miss)
- Operating Margin: 16.9%, up from 7.9% in the same quarter last year
- Market Capitalization: $12.89 billion
"Our third quarter results were marked by impressive EBITDA growth in Macau, and continued outperformance in Las Vegas," said Craig Billings, CEO of Wynn Resorts, Limited.
Company Overview
Founded by the former Mirage Resorts CEO, Wynn Resorts (NASDAQ: WYNN) is a global developer and operator of high-end hotels and casinos, known for its luxurious properties and premium guest services.
Revenue Growth
Examining a company’s long-term performance can provide clues about its quality. Any business can put up a good quarter or two, but many enduring ones grow for years. Thankfully, Wynn Resorts’s 18.3% annualized revenue growth over the last five years was solid. Its growth beat the average consumer discretionary company and shows its offerings resonate with customers.
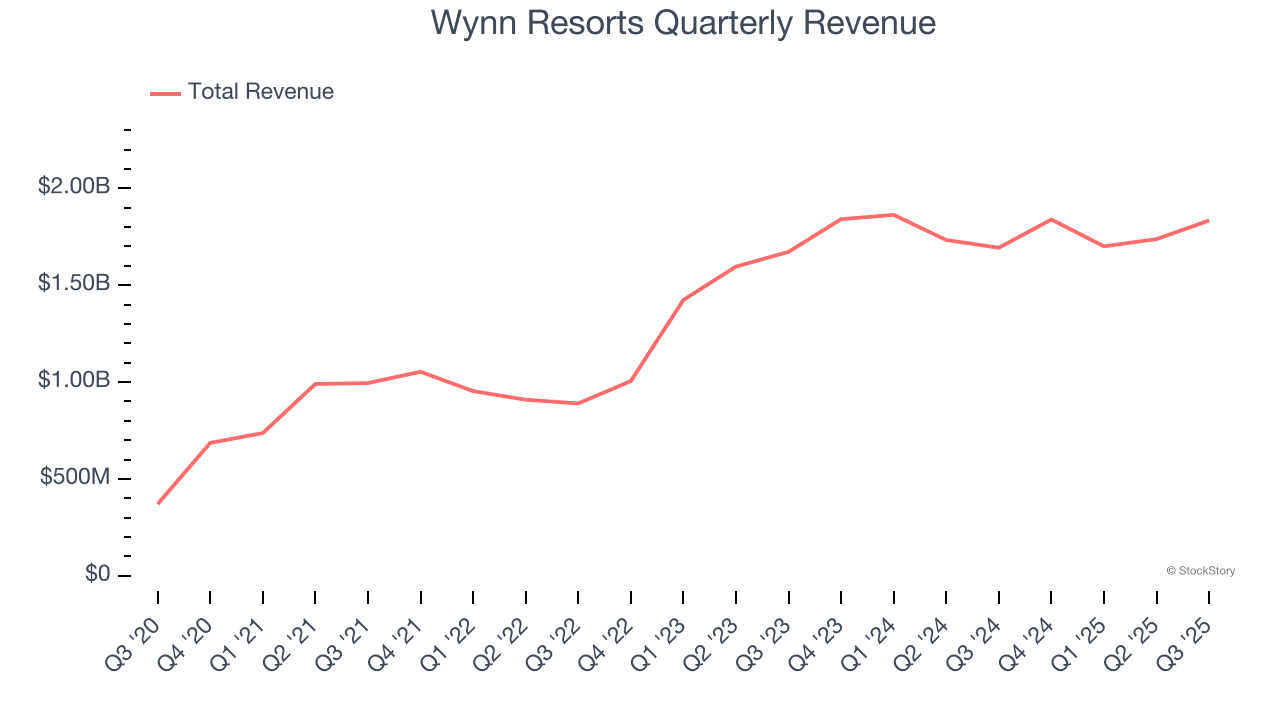
We at StockStory place the most emphasis on long-term growth, but within consumer discretionary, a stretched historical view may miss a company riding a successful new product or trend. Wynn Resorts’s recent performance shows its demand has slowed as its annualized revenue growth of 11.7% over the last two years was below its five-year trend. Note that COVID hurt Wynn Resorts’s business in 2020 and part of 2021, and it bounced back in a big way thereafter. 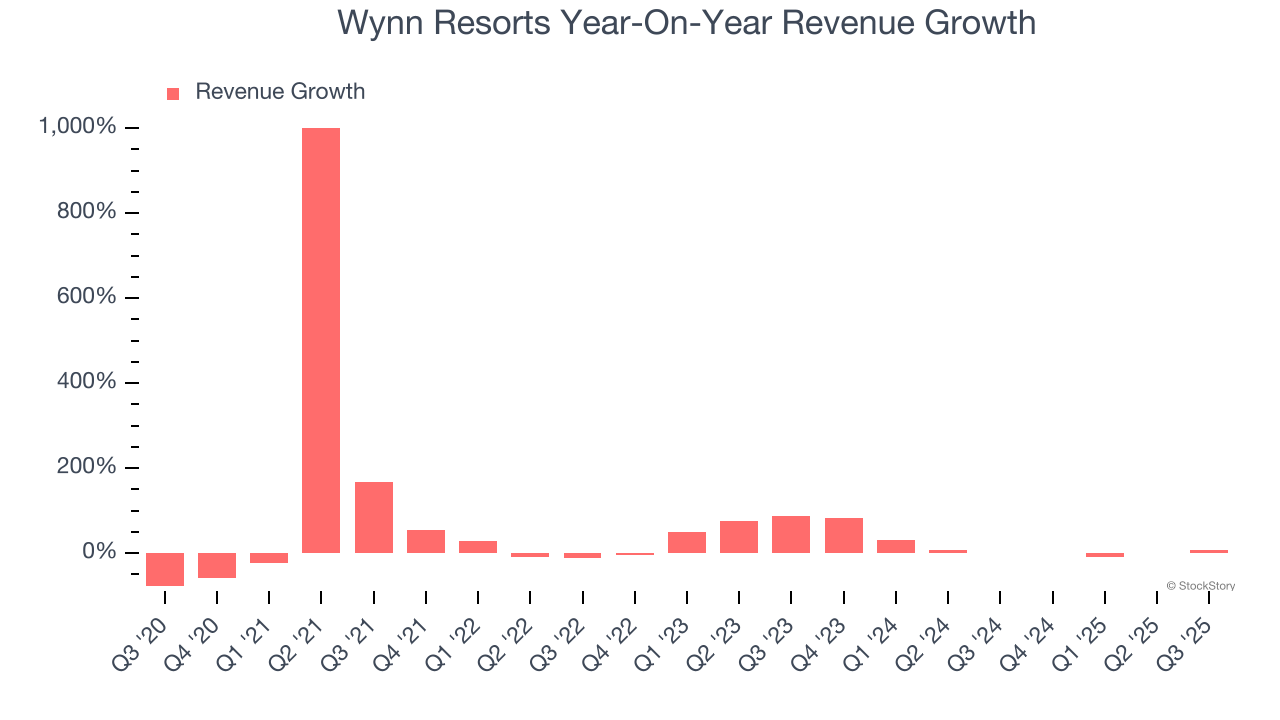
Wynn Resorts also breaks out the revenue for its three most important segments: Casino, Hotel, and Dining and Entertainment, which are 29.6%, 1.2%, and 10.5% of revenue. Over the last two years, Wynn Resorts’s Casino revenue (Poker, slots) averaged 21% year-on-year growth while its Hotel (overnight bookings) and Dining and Entertainment (food, beverage, Wynn Interactive) revenues averaged declines of 5.2% and 1.4%. 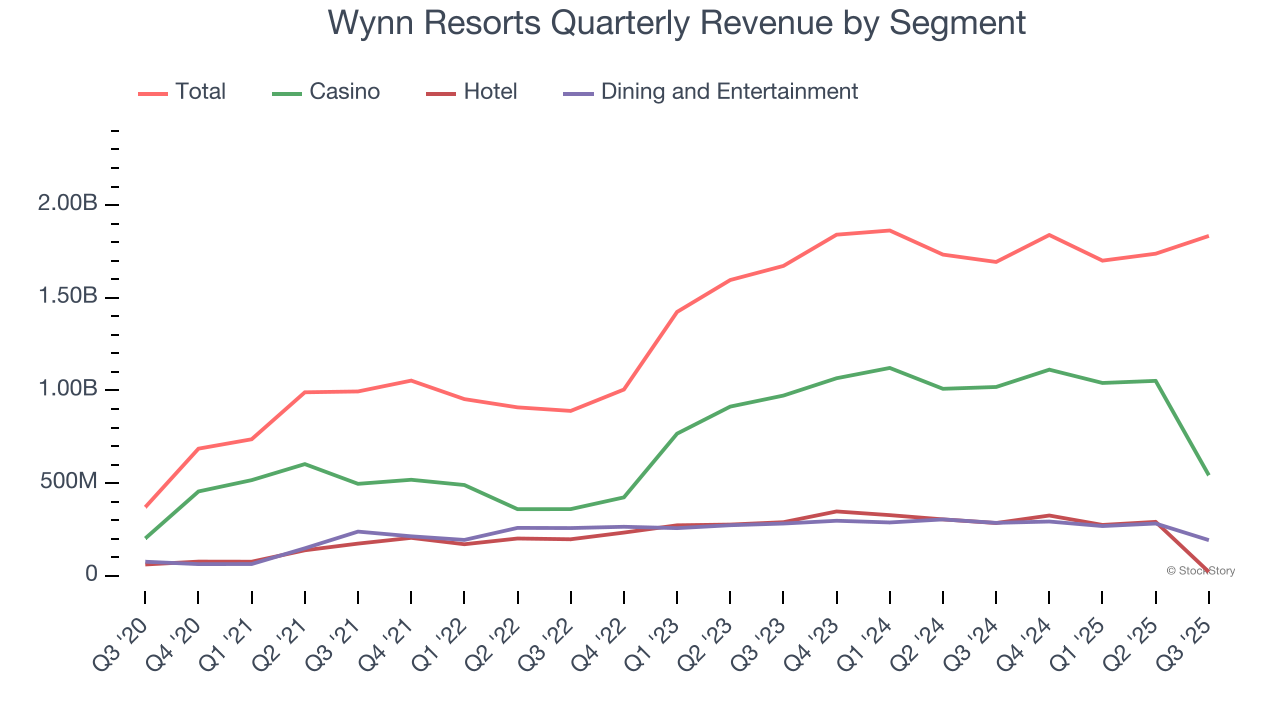
This quarter, Wynn Resorts reported year-on-year revenue growth of 8.3%, and its $1.83 billion of revenue exceeded Wall Street’s estimates by 3.4%.
Looking ahead, sell-side analysts expect revenue to grow 2.4% over the next 12 months, a deceleration versus the last two years. This projection doesn't excite us and implies its products and services will face some demand challenges.
The 1999 book Gorilla Game predicted Microsoft and Apple would dominate tech before it happened. Its thesis? Identify the platform winners early. Today, enterprise software companies embedding generative AI are becoming the new gorillas. a profitable, fast-growing enterprise software stock that is already riding the automation wave and looking to catch the generative AI next.
Operating Margin
Operating margin is a key measure of profitability. Think of it as net income - the bottom line - excluding the impact of taxes and interest on debt, which are less connected to business fundamentals.
Wynn Resorts’s operating margin has risen over the last 12 months and averaged 16.4% over the last two years. On top of that, its profitability was top-notch for a consumer discretionary business, showing it’s an well-run company with an efficient cost structure.
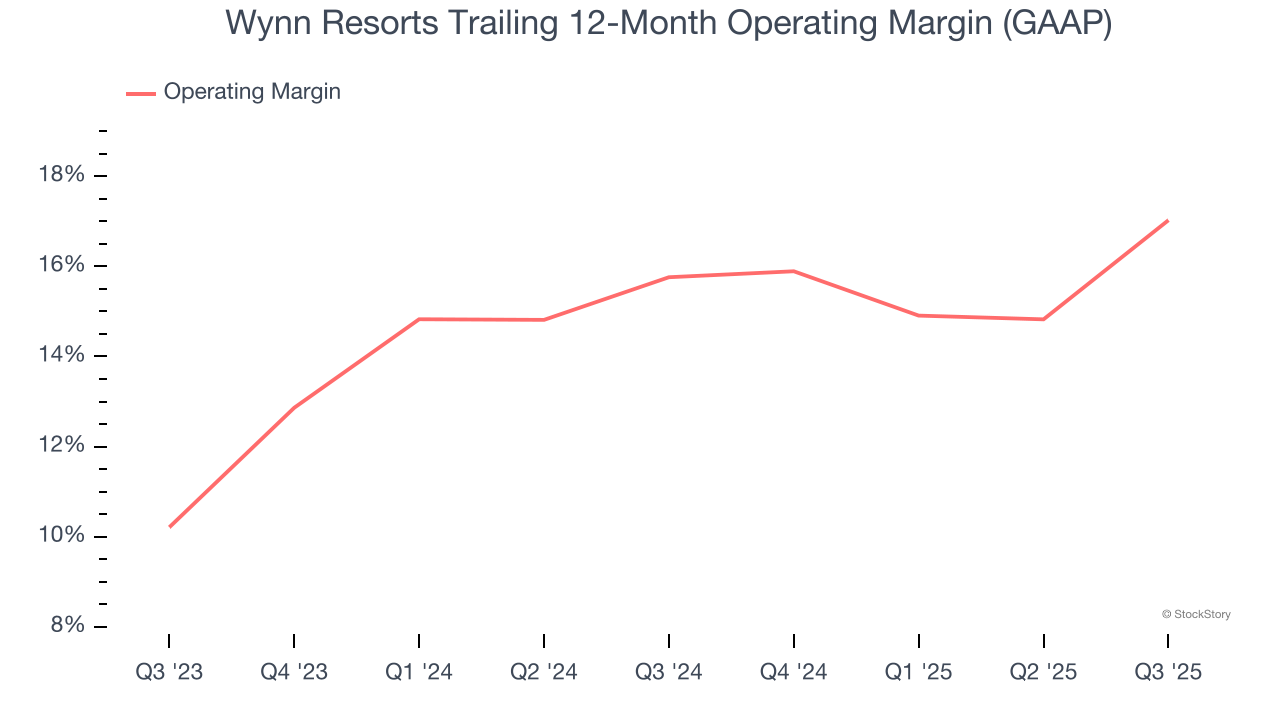
This quarter, Wynn Resorts generated an operating margin profit margin of 16.9%, up 9.1 percentage points year on year. This increase was a welcome development and shows it was more efficient.
Earnings Per Share
Revenue trends explain a company’s historical growth, but the long-term change in earnings per share (EPS) points to the profitability of that growth – for example, a company could inflate its sales through excessive spending on advertising and promotions.
Wynn Resorts’s full-year EPS flipped from negative to positive over the last five years. This is encouraging and shows it’s at a critical moment in its life.
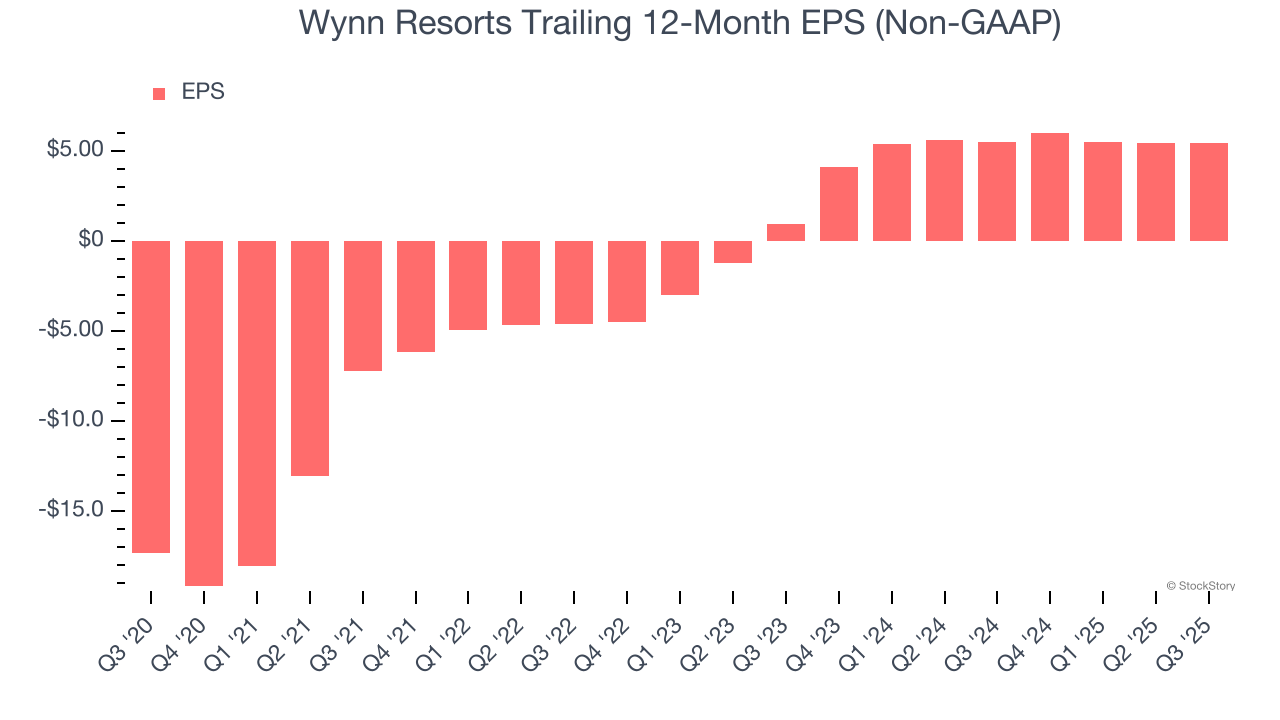
In Q3, Wynn Resorts reported adjusted EPS of $0.86, down from $0.90 in the same quarter last year. This print missed analysts’ estimates, but we care more about long-term adjusted EPS growth than short-term movements. Over the next 12 months, Wall Street expects Wynn Resorts’s full-year EPS of $5.44 to shrink by 4.8%.
Key Takeaways from Wynn Resorts’s Q3 Results
It was encouraging to see Wynn Resorts beat analysts’ revenue expectations this quarter. On the other hand, its Dining and Entertainment revenue missed and its Hotel revenue fell short of Wall Street’s estimates. Overall, this quarter could have been better. The stock traded up 1.2% to $124.01 immediately after reporting.
Is Wynn Resorts an attractive investment opportunity right now? When making that decision, it’s important to consider its valuation, business qualities, as well as what has happened in the latest quarter. We cover that in our actionable full research report which you can read here, it’s free for active Edge members.


