
Johnson Controls has followed the market’s trajectory closely, rising in tandem with the S&P 500 over the past six months. The stock has climbed by 10.3% to $115.26 per share while the index has gained 14.4%.
Is there a buying opportunity in Johnson Controls, or does it present a risk to your portfolio? See what our analysts have to say in our full research report, it’s free for active Edge members.
Why Is Johnson Controls Not Exciting?
We're cautious about Johnson Controls. Here are three reasons why JCI doesn't excite us and a stock we'd rather own.
1. Slow Organic Growth Suggests Waning Demand In Core Business
We can better understand Commercial Building Products companies by analyzing their organic revenue. This metric gives visibility into Johnson Controls’s core business because it excludes one-time events such as mergers, acquisitions, and divestitures along with foreign currency fluctuations - non-fundamental factors that can manipulate the income statement.
Over the last two years, Johnson Controls’s organic revenue averaged 5% year-on-year growth. This performance was underwhelming and suggests it may need to improve its products, pricing, or go-to-market strategy, which can add an extra layer of complexity to its operations. 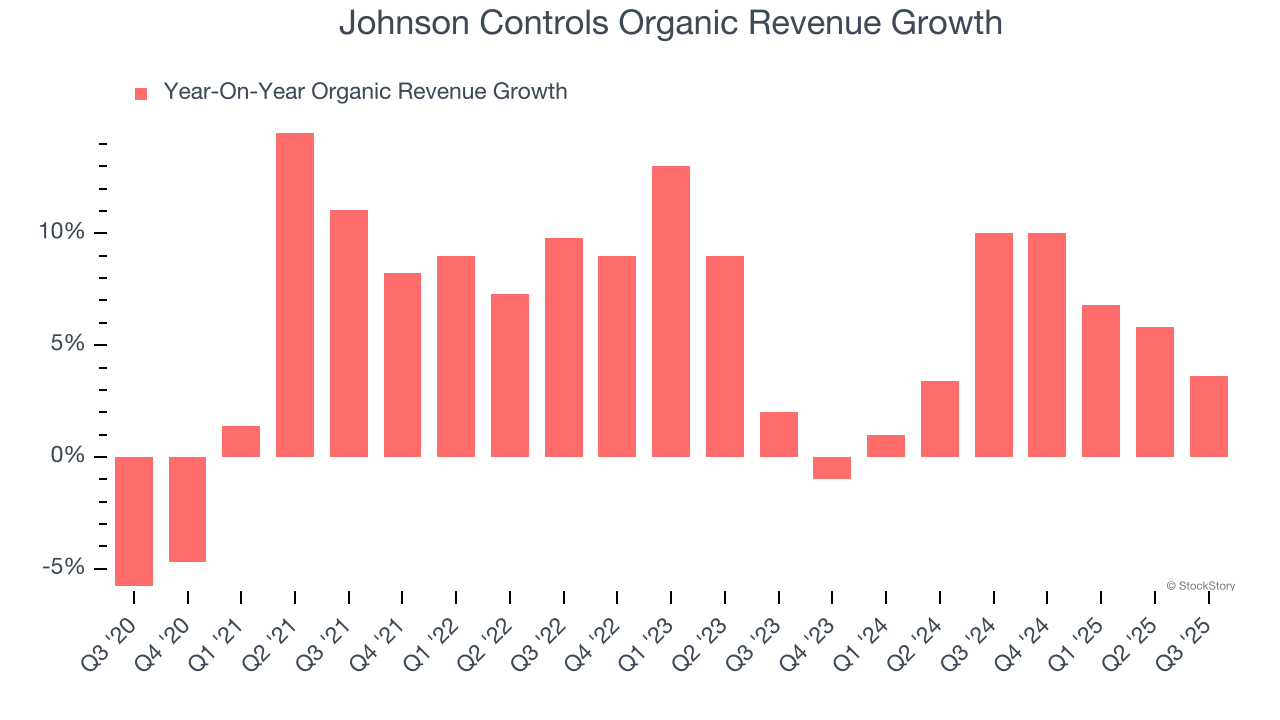
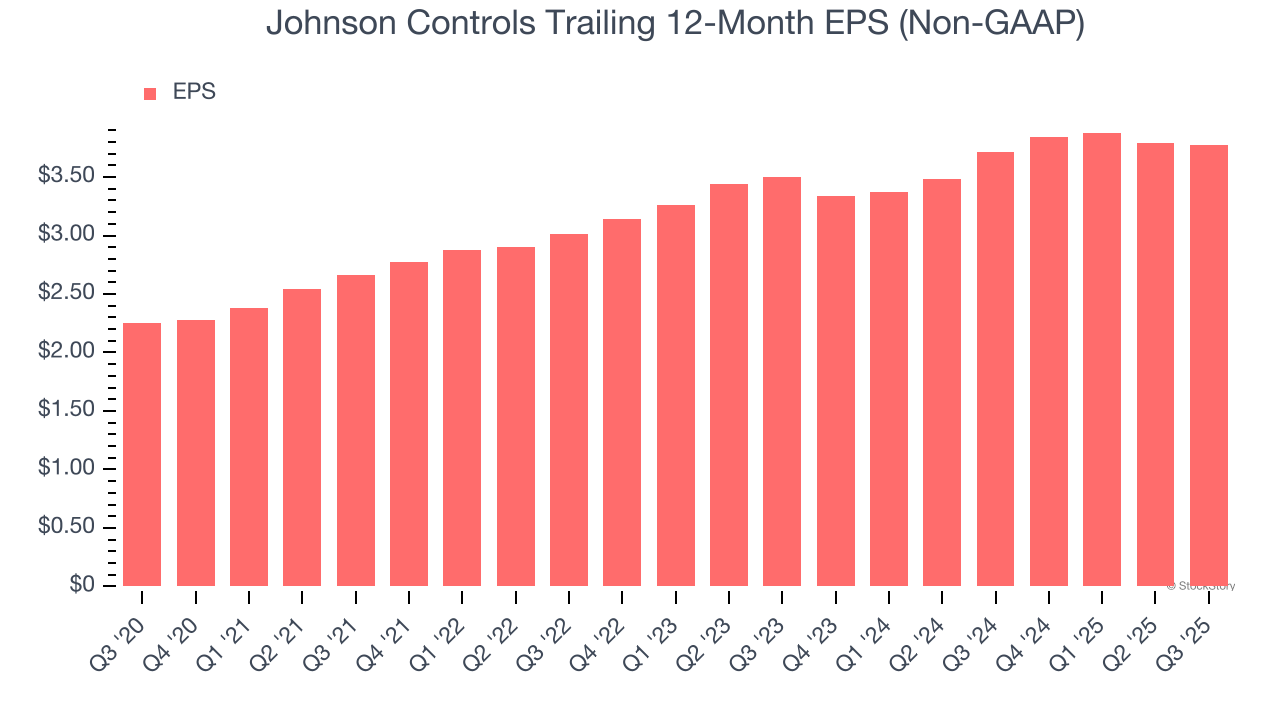
2. Recent EPS Growth Below Our Standards
Although long-term earnings trends give us the big picture, we like to analyze EPS over a shorter period to see if we are missing a change in the business.
Johnson Controls’s weak 3.8% annual EPS growth over the last two years aligns with its revenue trend. This tells us it maintained its per-share profitability as it expanded.
3. Previous Growth Initiatives Haven’t Impressed
Growth gives us insight into a company’s long-term potential, but how capital-efficient was that growth? Enter ROIC, a metric showing how much operating profit a company generates relative to the money it has raised (debt and equity).
Johnson Controls historically did a mediocre job investing in profitable growth initiatives. Its five-year average ROIC was 7.2%, somewhat low compared to the best industrials companies that consistently pump out 20%+.

Final Judgment
Johnson Controls’s business quality ultimately falls short of our standards. That said, the stock currently trades at 25.7× forward P/E (or $115.26 per share). Beauty is in the eye of the beholder, but our analysis shows the upside isn’t great compared to the potential downside. We're pretty confident there are more exciting stocks to buy at the moment. We’d suggest looking at the most dominant software business in the world.
High-Quality Stocks for All Market Conditions
If your portfolio success hinges on just 4 stocks, your wealth is built on fragile ground. You have a small window to secure high-quality assets before the market widens and these prices disappear.
Don’t wait for the next volatility shock. Check out our Top 6 Stocks for this week. This is a curated list of our High Quality stocks that have generated a market-beating return of 244% over the last five years (as of June 30, 2025).
Stocks that have made our list include now familiar names such as Nvidia (+1,326% between June 2020 and June 2025) as well as under-the-radar businesses like the once-small-cap company Exlservice (+354% five-year return). Find your next big winner with StockStory today.
StockStory is growing and hiring equity analyst and marketing roles. Are you a 0 to 1 builder passionate about the markets and AI? See the open roles here.


