Used automotive vehicle retailer Carmax (NYSE: KMX) reported Q4 CY2025 results beating Wall Street’s revenue expectations, but sales fell by 6.9% year on year to $5.79 billion. Its GAAP profit of $0.43 per share was 36.1% above analysts’ consensus estimates.
Is now the time to buy CarMax? Find out by accessing our full research report, it’s free for active Edge members.
CarMax (KMX) Q4 CY2025 Highlights:
- Revenue: $5.79 billion vs analyst estimates of $5.61 billion (6.9% year-on-year decline, 3.3% beat)
- EPS (GAAP): $0.43 vs analyst estimates of $0.32 (36.1% beat)
- Q4 guidance: "we anticipate lowering retail used unit margins in the fourth quarter." and "we expect marketing spend on a total unit basis to be up year-over-year in the fourth quarter, though to a lesser degree than during the third quarter, with a focus on investing in acquisition to drive buys and sales."
- Operating Margin: 0.1%, down from 3.2% in the same quarter last year
- Free Cash Flow was $1.11 billion, up from -$150.6 million in the same quarter last year
- Locations: 250 at quarter end, up from 245 in the same quarter last year
- Same-Store Sales fell 8.1% year on year (0.5% in the same quarter last year)
- Market Capitalization: $6.03 billion
“I’m honored to serve as Interim President and CEO at this important juncture for CarMax. Our unmatched physical and digital infrastructure, beloved national brand, and award-winning culture provide us with incredible advantages. Despite these advantages, based on recent results, it is clear CarMax needs change,” said David McCreight, Interim President and Chief Executive Officer.
Company Overview
Known for its transparent, customer-centric approach and wide selection of vehicles, Carmax (NYSE: KMX) is the largest automotive retailer in the United States.
Revenue Growth
A company’s long-term performance is an indicator of its overall quality. Any business can put up a good quarter or two, but many enduring ones grow for years.
With $25.94 billion in revenue over the past 12 months, CarMax is one of the larger companies in the consumer retail industry and benefits from a well-known brand that influences purchasing decisions. However, its scale is a double-edged sword because it’s harder to find incremental growth when you’ve penetrated most of the market. To expand meaningfully, CarMax likely needs to tweak its prices or enter new markets.
As you can see below, CarMax struggled to generate demand over the last three years (we compare to 2019 to normalize for COVID-19 impacts). Its sales dropped by 6.4% annually despite opening new stores. This implies its underperformance was driven by lower sales at existing, established locations.

This quarter, CarMax’s revenue fell by 6.9% year on year to $5.79 billion but beat Wall Street’s estimates by 3.3%.
Looking ahead, sell-side analysts expect revenue to decline by 2.7% over the next 12 months. it’s hard to get excited about a company that is struggling with demand.
Software is eating the world and there is virtually no industry left that has been untouched by it. That drives increasing demand for tools helping software developers do their jobs, whether it be monitoring critical cloud infrastructure, integrating audio and video functionality, or ensuring smooth content streaming. Click here to access a free report on our 3 favorite stocks to play this generational megatrend.
Store Performance
Number of Stores
A retailer’s store count influences how much it can sell and how quickly revenue can grow.
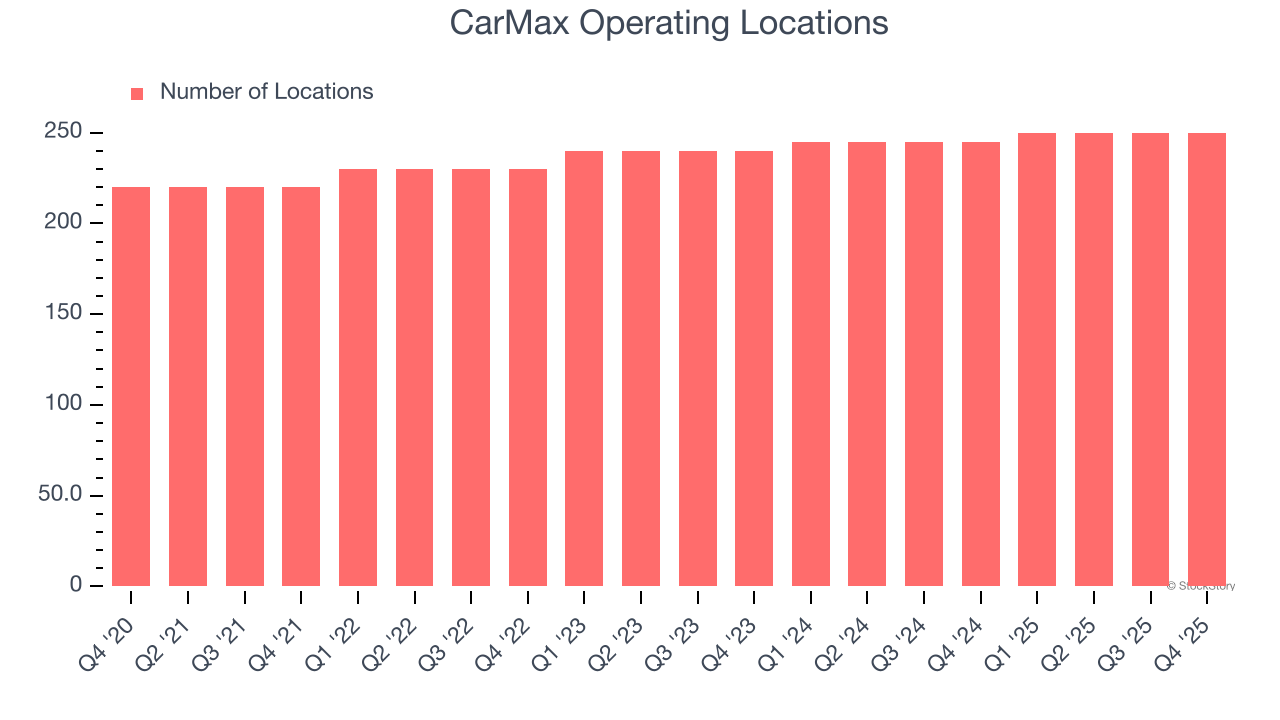
CarMax operated 250 locations in the latest quarter. It has generally opened new stores over the last two years and averaged 2.1% annual growth, faster than the broader consumer retail sector.
When a retailer opens new stores, it usually means it’s investing for growth because demand is greater than supply, especially in areas where consumers may not have a store within reasonable driving distance.
Same-Store Sales
A company's store base only paints one part of the picture. When demand is high, it makes sense to open more. But when demand is low, it’s prudent to close some locations and use the money in other ways. Same-store sales is an industry measure of whether revenue is growing at those existing stores and is driven by customer visits (often called traffic) and the average spending per customer (ticket).
CarMax’s demand has been shrinking over the last two years as its same-store sales have averaged 1.3% annual declines. This performance is concerning - it shows CarMax artificially boosts its revenue by building new stores. We’d like to see a company’s same-store sales rise before it takes on the costly, capital-intensive endeavor of expanding its store base.
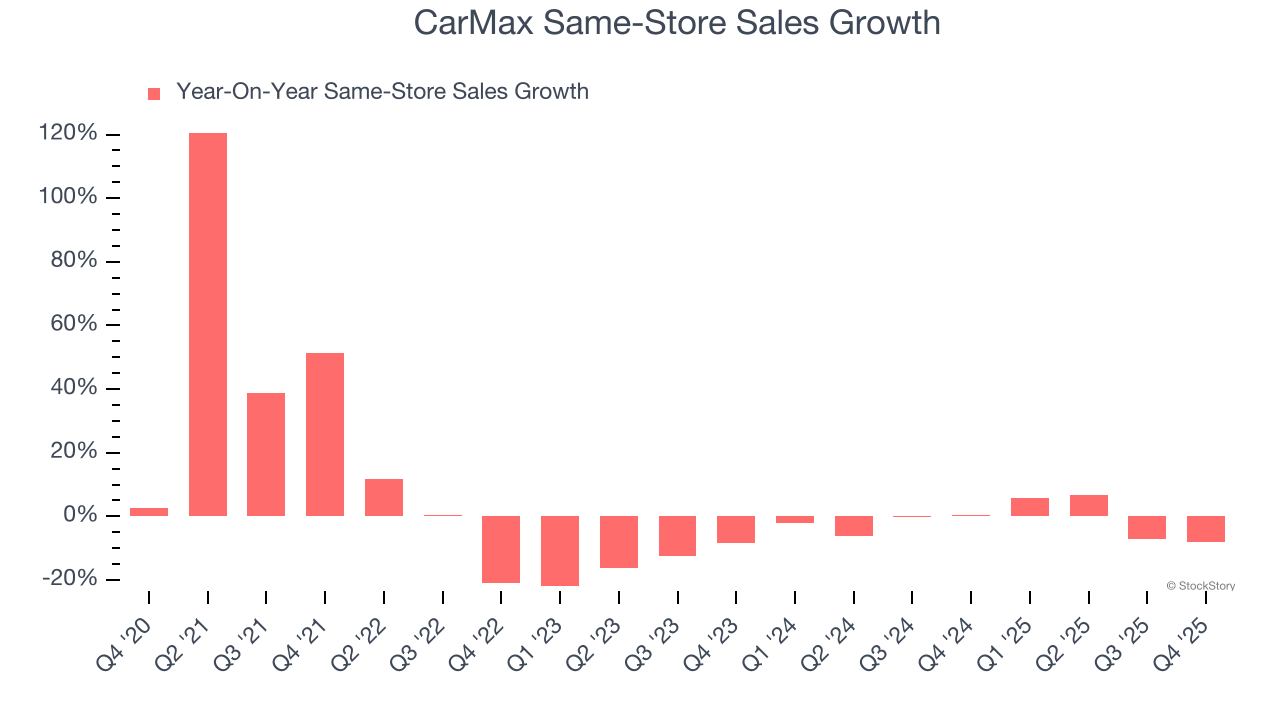
In the latest quarter, CarMax’s same-store sales fell by 8.1% year on year. This decrease represents a further deceleration from its historical levels. We hope the business can get back on track.
Key Takeaways from CarMax’s Q4 Results
It was good to see CarMax beat analysts’ EPS expectations this quarter. We were also glad its revenue outperformed Wall Street’s estimates. On the other hand, management gave qualitative Q4 guidance that calls for lower margins to reinvigorate sales, something the market seems to dislike. Overall, this print was mixed but still had some key positives. The market seemed to be hoping for more, and the stock traded down 4.4% to $39.25 immediately after reporting.
Should you buy the stock or not? We think that the latest quarter is only one piece of the longer-term business quality puzzle. Quality, when combined with valuation, can help determine if the stock is a buy. We cover that in our actionable full research report which you can read here, it’s free for active Edge members.


