
Shareholders of Iridium would probably like to forget the past six months even happened. The stock dropped 41.6% and now trades at $16.59. This may have investors wondering how to approach the situation.
Is there a buying opportunity in Iridium, or does it present a risk to your portfolio? See what our analysts have to say in our full research report, it’s free for active Edge members.
Why Is Iridium Not Exciting?
Despite the more favorable entry price, we're sitting this one out for now. Here are three reasons we avoid IRDM and a stock we'd rather own.
1. Projected Revenue Growth Is Slim
Forecasted revenues by Wall Street analysts signal a company’s potential. Predictions may not always be accurate, but accelerating growth typically boosts valuation multiples and stock prices while slowing growth does the opposite.
Over the next 12 months, sell-side analysts expect Iridium’s revenue to rise by 2.3%, a slight deceleration versus its 8.6% annualized growth for the past five years. This projection is underwhelming and implies its products and services will face some demand challenges.
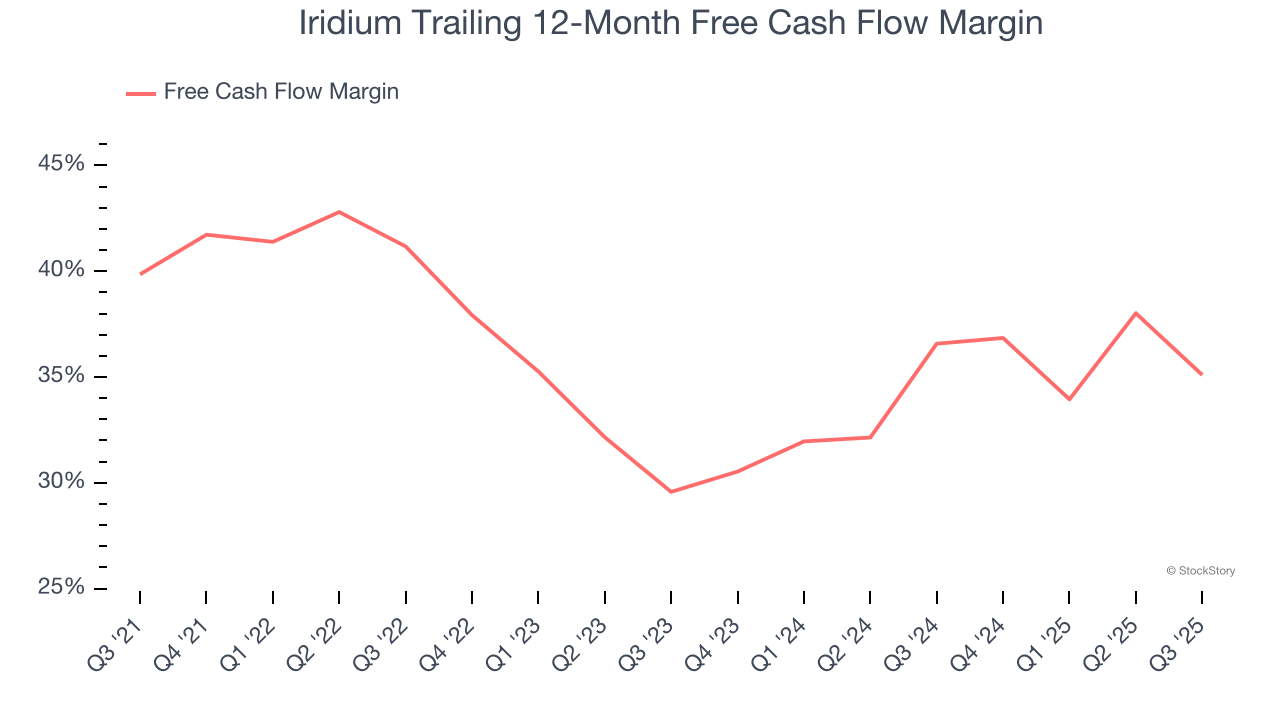
2. Free Cash Flow Margin Dropping
If you’ve followed StockStory for a while, you know we emphasize free cash flow. Why, you ask? We believe that in the end, cash is king, and you can’t use accounting profits to pay the bills.
As you can see below, Iridium’s margin dropped by 4.8 percentage points over the last five years. If its declines continue, it could signal increasing investment needs and capital intensity. Iridium’s free cash flow margin for the trailing 12 months was 35.1%.
3. Previous Growth Initiatives Haven’t Impressed
Growth gives us insight into a company’s long-term potential, but how capital-efficient was that growth? Enter ROIC, a metric showing how much operating profit a company generates relative to the money it has raised (debt and equity).
Iridium historically did a mediocre job investing in profitable growth initiatives. Its five-year average ROIC was 5.2%, somewhat low compared to the best business services companies that consistently pump out 25%+.

Final Judgment
Iridium’s business quality ultimately falls short of our standards. Following the recent decline, the stock trades at 13.8× forward P/E (or $16.59 per share). This valuation is reasonable, but the company’s shakier fundamentals present too much downside risk. We're pretty confident there are superior stocks to buy right now. We’d recommend looking at an all-weather company that owns household favorite Taco Bell.
Stocks We Like More Than Iridium
Your portfolio can’t afford to be based on yesterday’s story. The risk in a handful of heavily crowded stocks is rising daily.
The names generating the next wave of massive growth are right here in our Top 5 Growth Stocks for this month. This is a curated list of our High Quality stocks that have generated a market-beating return of 244% over the last five years (as of June 30, 2025).
Stocks that have made our list include now familiar names such as Nvidia (+1,326% between June 2020 and June 2025) as well as under-the-radar businesses like the once-micro-cap company Tecnoglass (+1,754% five-year return). Find your next big winner with StockStory today.


