Over the past six months, Rogers has been a great trade, beating the S&P 500 by 24.9%. Its stock price has climbed to $92.37, representing a healthy 37.9% increase. This was partly due to its solid quarterly results, and the performance may have investors wondering how to approach the situation.
Is now the time to buy Rogers, or should you be careful about including it in your portfolio? Get the full stock story straight from our expert analysts, it’s free for active Edge members.
Why Do We Think Rogers Will Underperform?
We’re happy investors have made money, but we're cautious about Rogers. Here are three reasons you should be careful with ROG and a stock we'd rather own.
1. Long-Term Revenue Growth Flatter Than a Pancake
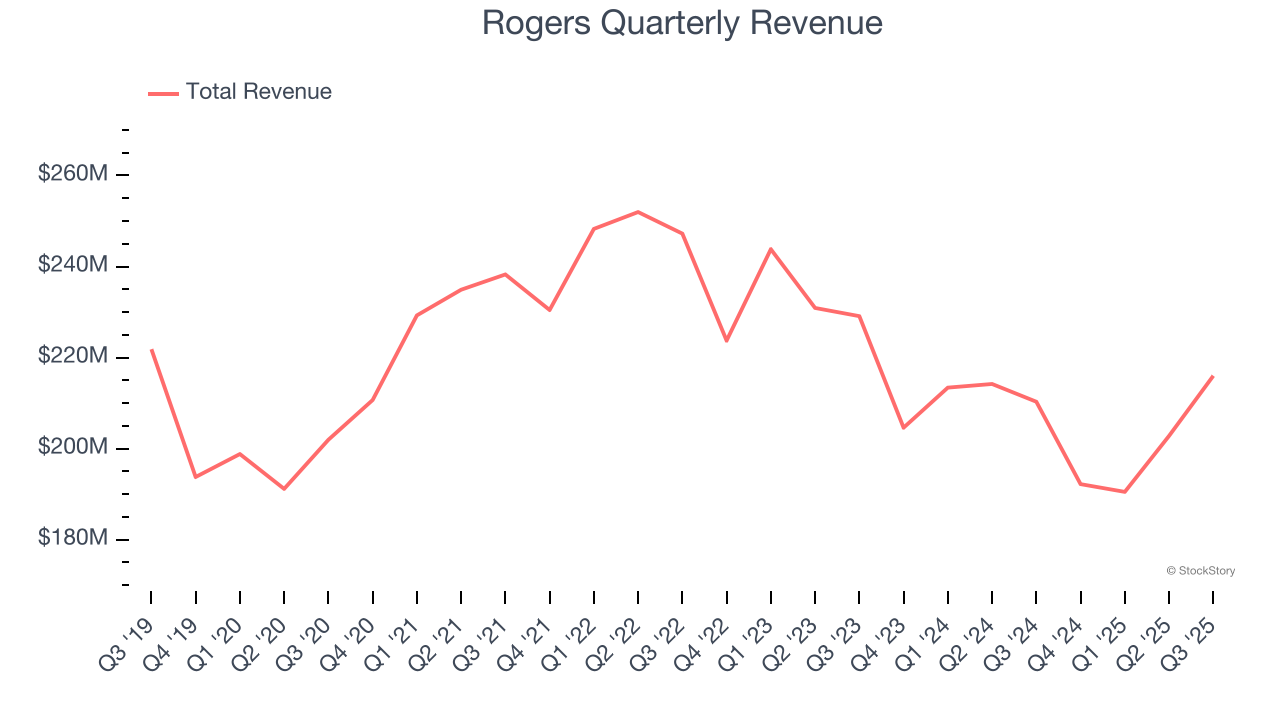
Reviewing a company’s long-term sales performance reveals insights into its quality. Any business can experience short-term success, but top-performing ones enjoy sustained growth for years. Unfortunately, Rogers struggled to consistently increase demand as its $801.5 million of sales for the trailing 12 months was close to its revenue five years ago. This wasn’t a great result and is a sign of poor business quality.
2. EPS Trending Down
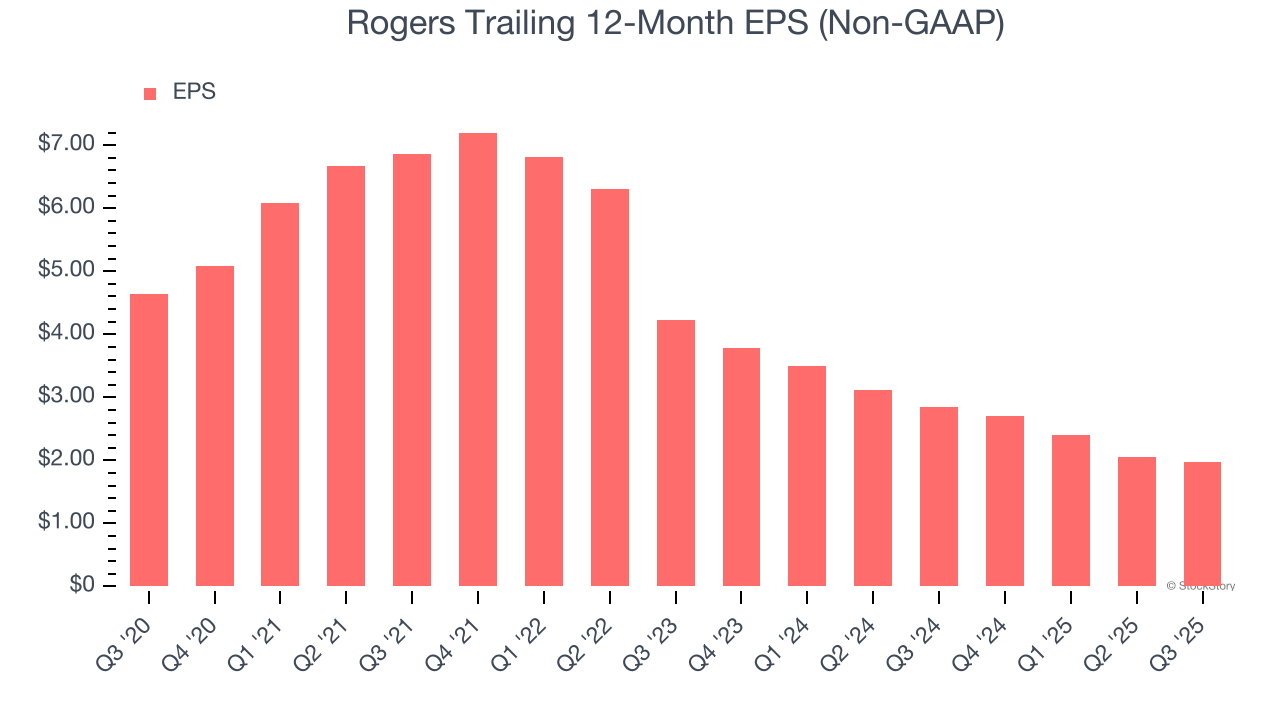
Analyzing the long-term change in earnings per share (EPS) shows whether a company's incremental sales were profitable – for example, revenue could be inflated through excessive spending on advertising and promotions.
Sadly for Rogers, its EPS declined by 15.7% annually over the last five years while its revenue was flat. This tells us the company struggled because its fixed cost base made it difficult to adjust to choppy demand.
3. Free Cash Flow Margin Dropping
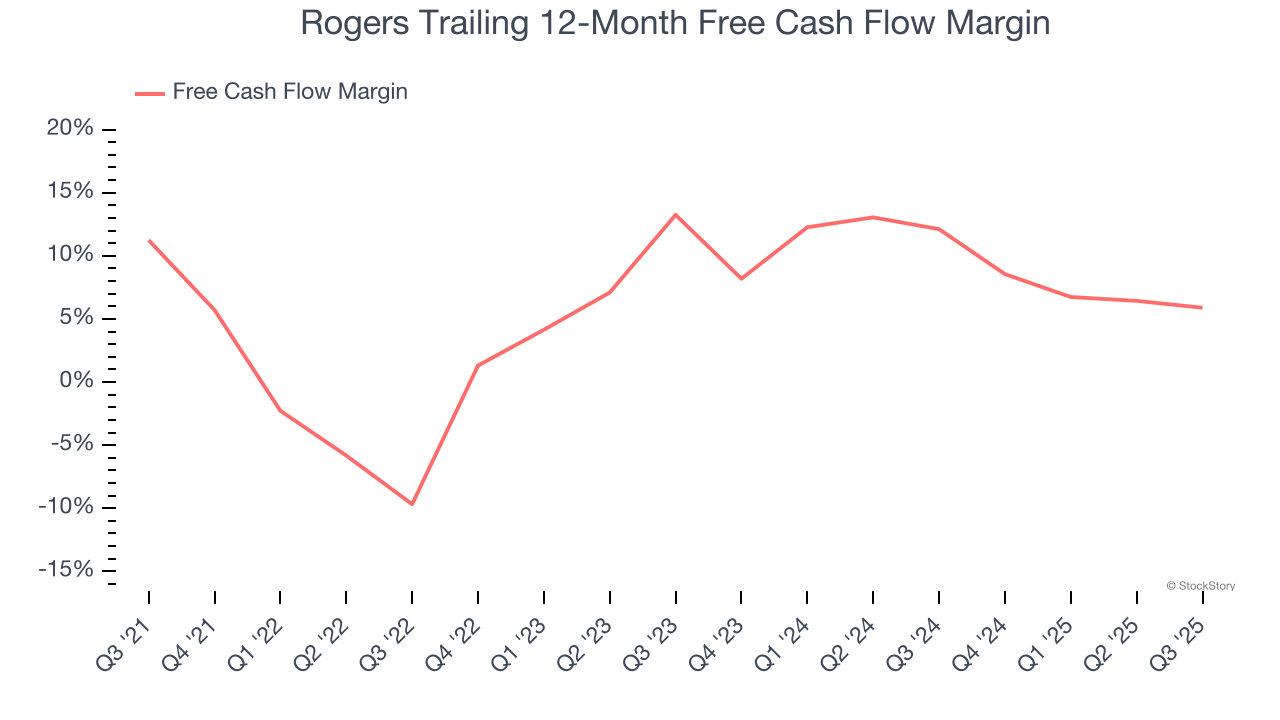
If you’ve followed StockStory for a while, you know we emphasize free cash flow. Why, you ask? We believe that in the end, cash is king, and you can’t use accounting profits to pay the bills.
As you can see below, Rogers’s margin dropped by 5.4 percentage points over the last five years. Continued declines could signal it is in the middle of an investment cycle. Rogers’s free cash flow margin for the trailing 12 months was 5.9%.
Final Judgment
We cheer for all companies making their customers lives easier, but in the case of Rogers, we’ll be cheering from the sidelines. With its shares outperforming the market lately, the stock trades at 29.6× forward P/E (or $92.37 per share). This valuation tells us it’s a bit of a market darling with a lot of good news priced in - you can find more timely opportunities elsewhere. We’d recommend looking at one of Charlie Munger’s all-time favorite businesses.
High-Quality Stocks for All Market Conditions
The market’s up big this year - but there’s a catch. Just 4 stocks account for half the S&P 500’s entire gain. That kind of concentration makes investors nervous, and for good reason. While everyone piles into the same crowded names, smart investors are hunting quality where no one’s looking - and paying a fraction of the price. Check out the high-quality names we’ve flagged in our Top 5 Strong Momentum Stocks for this week. This is a curated list of our High Quality stocks that have generated a market-beating return of 244% over the last five years (as of June 30, 2025).
Stocks that have made our list include now familiar names such as Nvidia (+1,326% between June 2020 and June 2025) as well as under-the-radar businesses like the once-micro-cap company Tecnoglass (+1,754% five-year return). Find your next big winner with StockStory today.


