
Since June 2025, Crown Holdings has been in a holding pattern, posting a small loss of 1% while floating around $102.56. The stock also fell short of the S&P 500’s 13% gain during that period.
Is there a buying opportunity in Crown Holdings, or does it present a risk to your portfolio? Get the full stock story straight from our expert analysts, it’s free for active Edge members.
Why Is Crown Holdings Not Exciting?
We're sitting this one out for now. Here are three reasons we avoid CCK and a stock we'd rather own.
1. Constant Currency Revenue Hits a Standstill
Investors interested in Industrial Packaging companies should track constant currency revenue in addition to reported revenue. This metric excludes currency movements, which are outside of Crown Holdings’s control and are not indicative of underlying demand.
Over the last two years, Crown Holdings failed to grow its constant currency revenue. This performance was underwhelming and implies there may be increasing competition or market saturation. It also suggests Crown Holdings might have to lower prices or invest in product improvements to accelerate growth, factors that can hinder near-term profitability. 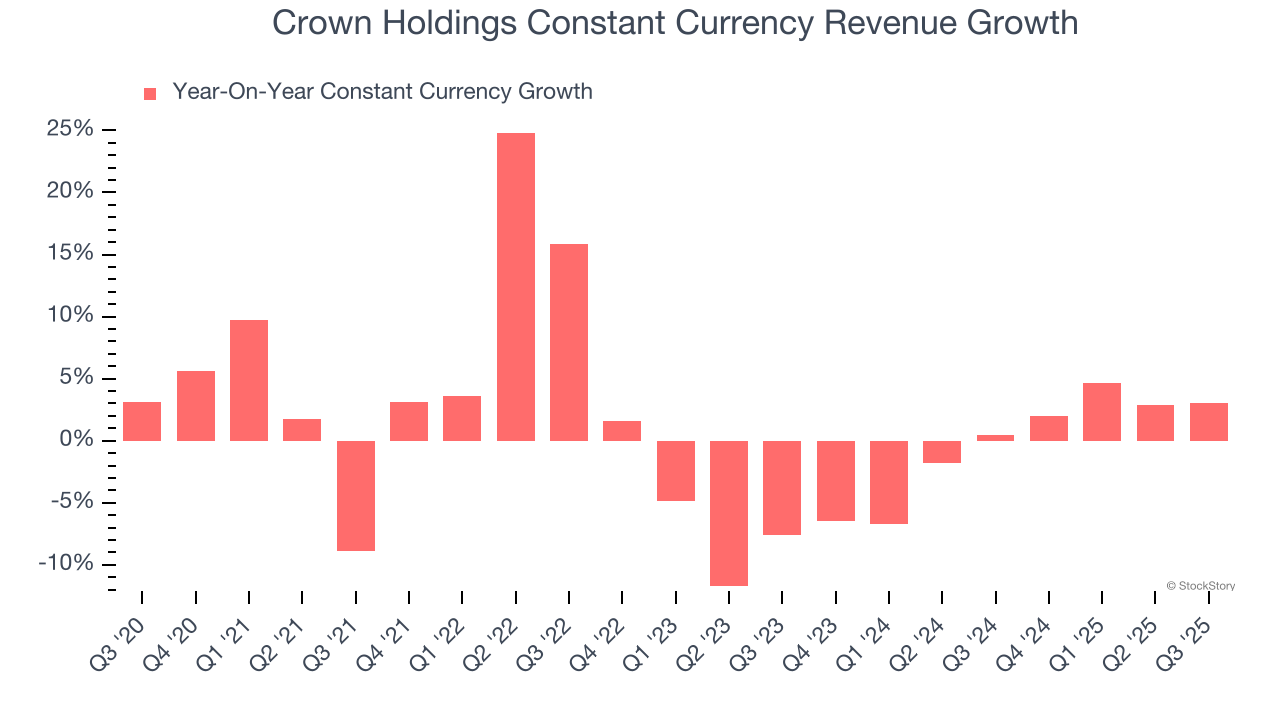
2. Projected Revenue Growth Is Slim
Forecasted revenues by Wall Street analysts signal a company’s potential. Predictions may not always be accurate, but accelerating growth typically boosts valuation multiples and stock prices while slowing growth does the opposite.
Over the next 12 months, sell-side analysts expect Crown Holdings’s revenue to rise by 3.1%. While this projection implies its newer products and services will fuel better top-line performance, it is still below average for the sector.
3. Low Gross Margin Reveals Weak Structural Profitability
Cost of sales for an industrials business is usually comprised of the direct labor, raw materials, and supplies needed to offer a product or service. These costs can be impacted by inflation and supply chain dynamics.
Crown Holdings has bad unit economics for an industrials business, signaling it operates in a competitive market. As you can see below, it averaged a 20.5% gross margin over the last five years. Said differently, Crown Holdings had to pay a chunky $79.53 to its suppliers for every $100 in revenue. 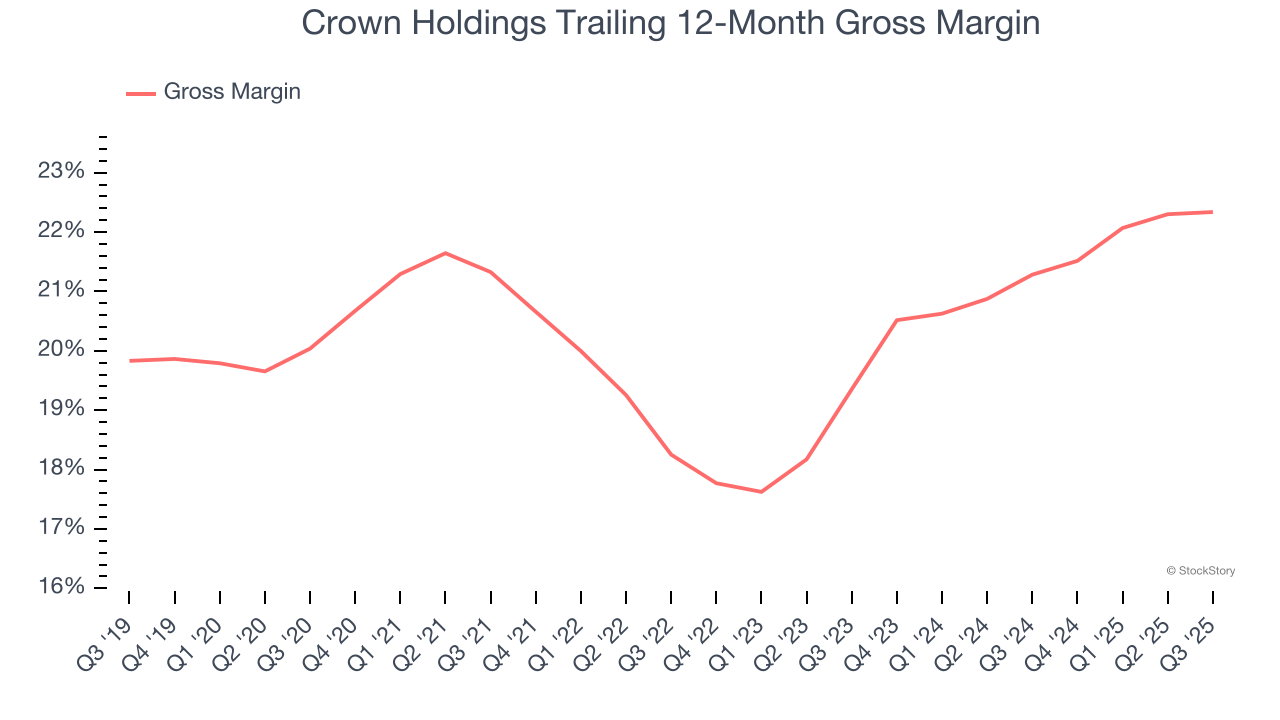
Final Judgment
Crown Holdings isn’t a terrible business, but it doesn’t pass our quality test. With its shares lagging the market recently, the stock trades at 12.9× forward P/E (or $102.56 per share). This valuation is reasonable, but the company’s shakier fundamentals present too much downside risk. We're pretty confident there are superior stocks to buy right now. We’d recommend looking at a fast-growing restaurant franchise with an A+ ranch dressing sauce.
Stocks We Like More Than Crown Holdings
The market’s up big this year - but there’s a catch. Just 4 stocks account for half the S&P 500’s entire gain. That kind of concentration makes investors nervous, and for good reason. While everyone piles into the same crowded names, smart investors are hunting quality where no one’s looking - and paying a fraction of the price. Check out the high-quality names we’ve flagged in our Top 6 Stocks for this week. This is a curated list of our High Quality stocks that have generated a market-beating return of 244% over the last five years (as of June 30, 2025).
Stocks that have made our list include now familiar names such as Nvidia (+1,326% between June 2020 and June 2025) as well as under-the-radar businesses like the once-small-cap company Exlservice (+354% five-year return). Find your next big winner with StockStory today.


