monday.com’s stock price has taken a beating over the past six months, shedding 48% of its value and falling to $145.80 per share. This may have investors wondering how to approach the situation.
Following the drawdown, is this a buying opportunity for MNDY? Find out in our full research report, it’s free for active Edge members.
Why Are We Positive On MNDY?
With its colorful interface of boards, columns, and automation that replaced the chaos of spreadsheets, monday.com (NASDAQ: MNDY) is a cloud-based work operating system that helps teams manage projects, track tasks, and streamline workflows through customizable interfaces.
1. ARR Surges as Recurring Revenue Flows In
While reported revenue for a software company can include low-margin items like implementation fees, annual recurring revenue (ARR) is a sum of the next 12 months of contracted revenue purely from software subscriptions, or the high-margin, predictable revenue streams that make SaaS businesses so valuable.
monday.com’s ARR punched in at $1.27 billion in Q3, and over the last four quarters, its year-on-year growth averaged 28.8%. This performance was fantastic and shows that customers are willing to take multi-year bets on the company’s technology. Its growth also makes monday.com a more predictable business, a tailwind for its valuation as investors typically prefer businesses with recurring revenue. 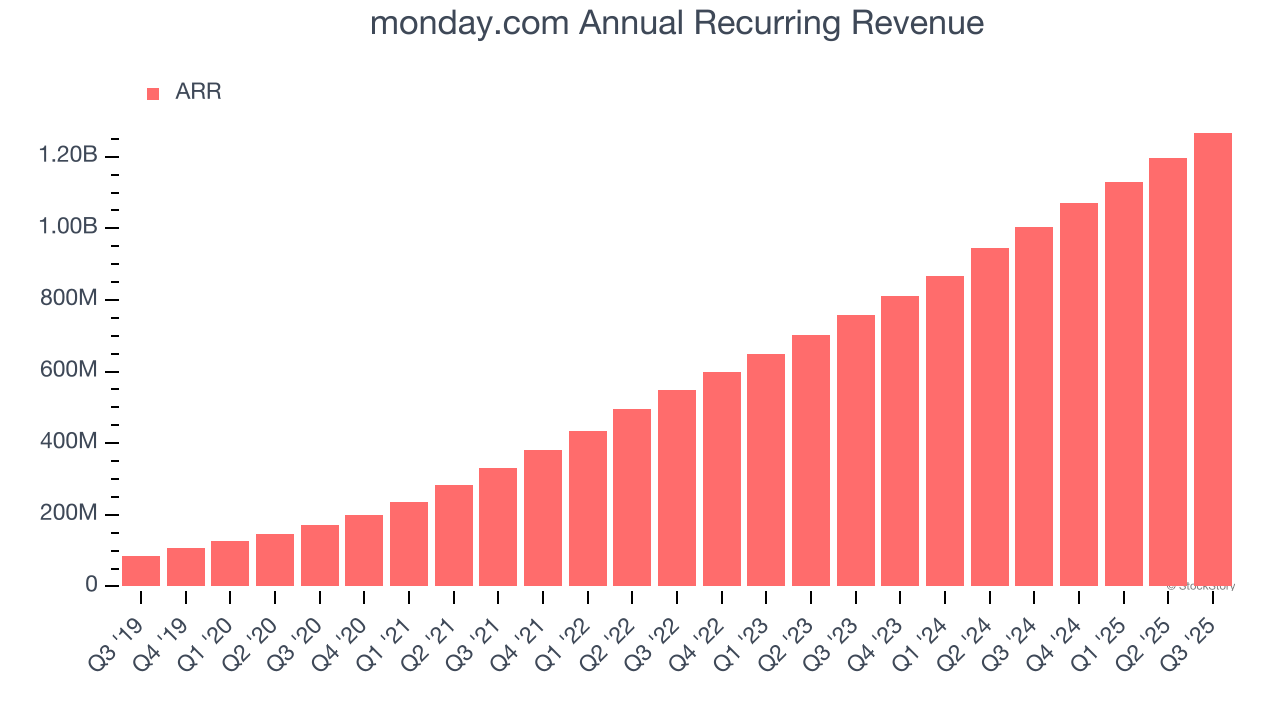
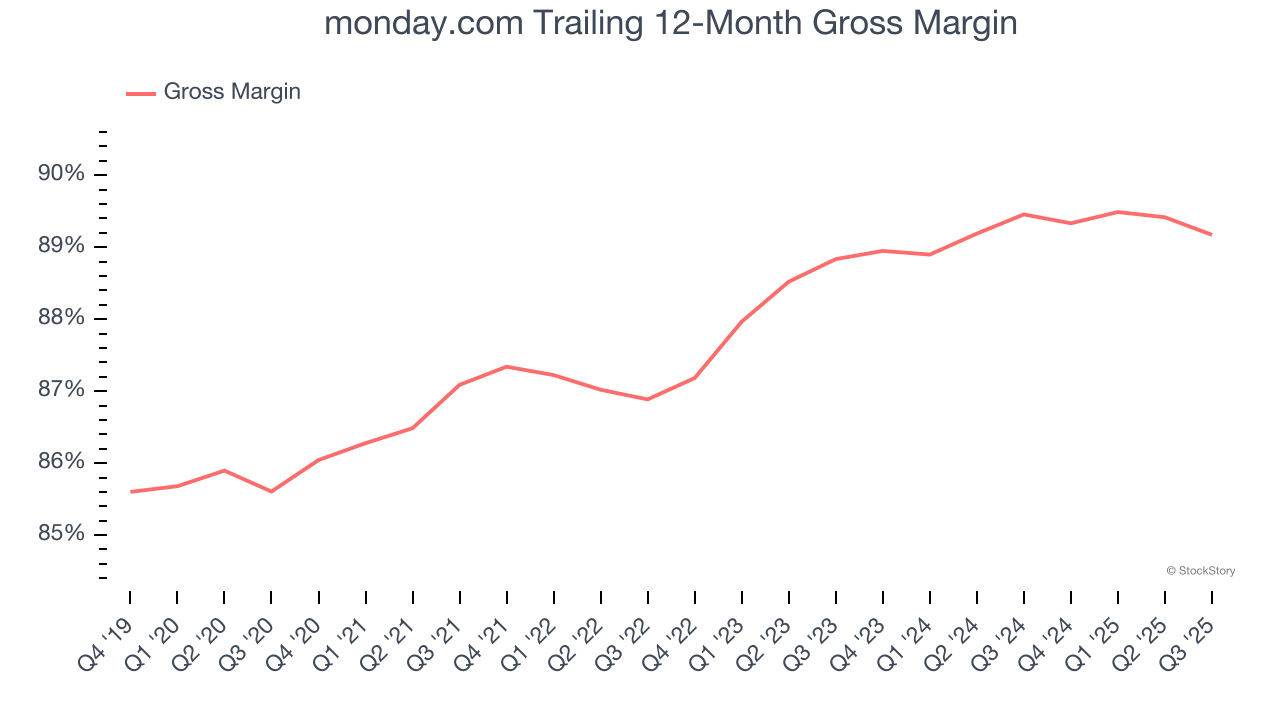
2. Elite Gross Margin Powers Best-In-Class Business Model
What makes the software-as-a-service model so attractive is that once the software is developed, it usually doesn’t cost much to provide it as an ongoing service. These minimal costs can include servers, licenses, and certain personnel.
monday.com’s gross margin is one of the best in the software sector, an output of its asset-lite business model and strong pricing power. It also enables the company to fund large investments in new products and sales during periods of rapid growth to achieve outsized profits at scale. As you can see below, it averaged an elite 89.2% gross margin over the last year. Said differently, roughly $89.17 was left to spend on selling, marketing, and R&D for every $100 in revenue.
The market not only cares about gross margin levels but also how they change over time because expansion creates firepower for profitability and free cash generation. monday.com has seen gross margins improve by 0.3 percentage points over the last 2 year, which is slightly better than average for software.
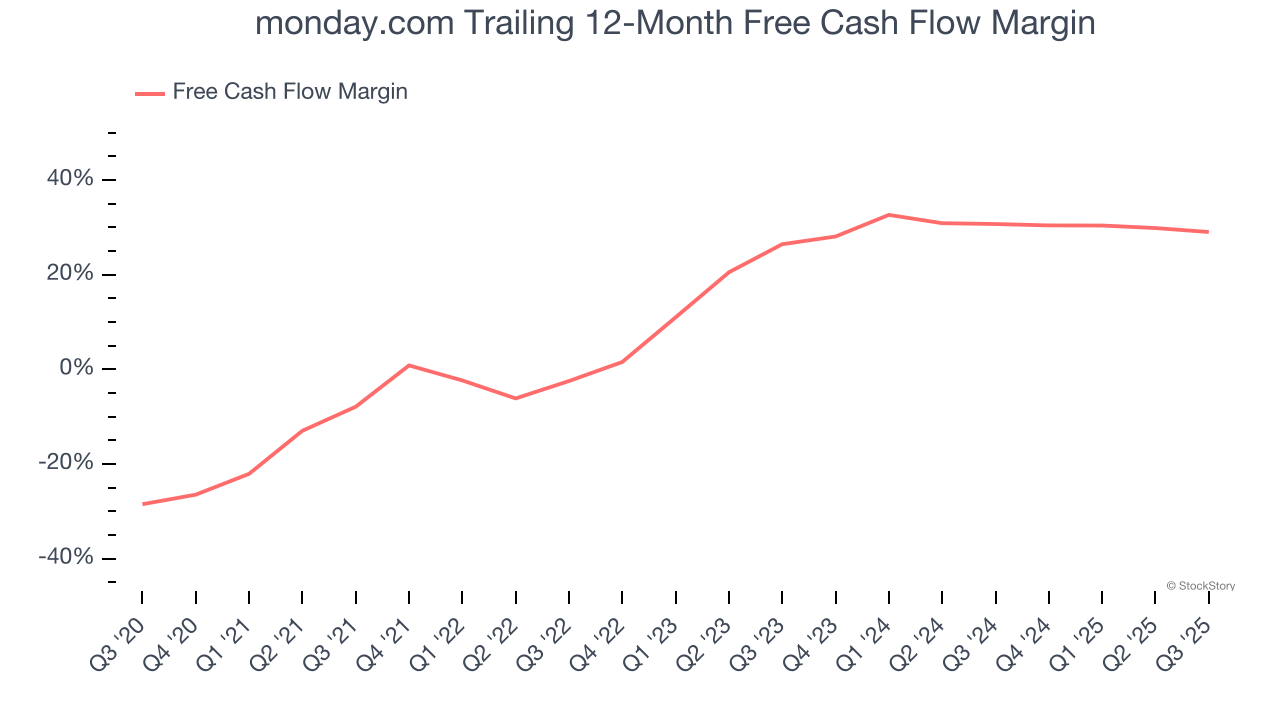
3. Excellent Free Cash Flow Margin Boosts Reinvestment Potential
If you’ve followed StockStory for a while, you know we emphasize free cash flow. Why, you ask? We believe that in the end, cash is king, and you can’t use accounting profits to pay the bills.
monday.com has shown robust cash profitability, driven by its attractive business model and cost-effective customer acquisition strategy that enable it to invest in new products and services rather than sales and marketing. The company’s free cash flow margin averaged 29% over the last year, quite impressive for a software business.
Final Judgment
These are just a few reasons why we think monday.com is an elite software company. After the recent drawdown, the stock trades at 5.4× forward price-to-sales (or $145.80 per share). Is now a good time to buy? See for yourself in our in-depth research report, it’s free for active Edge members.
High-Quality Stocks for All Market Conditions
Your portfolio can’t afford to be based on yesterday’s story. The risk in a handful of heavily crowded stocks is rising daily.
The names generating the next wave of massive growth are right here in our Top 9 Market-Beating Stocks. This is a curated list of our High Quality stocks that have generated a market-beating return of 244% over the last five years (as of June 30, 2025).
Stocks that have made our list include now familiar names such as Nvidia (+1,326% between June 2020 and June 2025) as well as under-the-radar businesses like the once-micro-cap company Kadant (+351% five-year return). Find your next big winner with StockStory today.


